Ecological Damage from Natural and Manmade Events
Contents
Satellites afford excellent means to monitor continuing ecological threats and damage and long term after effects to the Earth�s natural surface and to areas relevant to human activities. Sometimes, ongoing ecological problems can be watched in near-real time using geostationary satellites. Much obvious damage is imposed on vegetation, such as acreage affected by forest fires and grassland burns. Also, normally very easy to see are the destruction and deposits associated with volcanic eruptions. Oil spills constitute another ecological catastrophe that often is detectable in Landsat-type imagery and under favorable conditions in radar scenes. Illustrative examples are given.
Ecological Damage from Natural and Manmade Events
Landsat and other satellites are very effective in characterizing ecological habitats and in monitoring any changes that threaten plant or animal life considered endangered or subject to undesirable influences. One of the most famous habitat focal points in recent years is the battle between environmentalists and the lumber industry over what timbering, such as the clear-cutting considered in Section 2, is doing to the very specialized conditions in which the Spotted Owl (shown below) prefers:
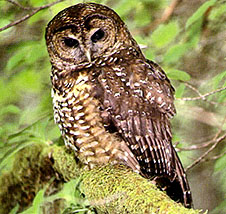
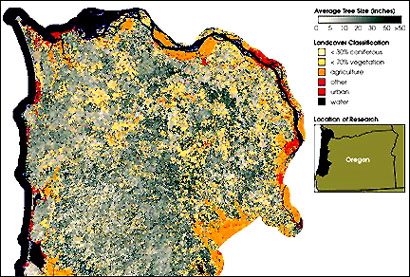
This species (seen just once by the writer [NMS], an avid bird watcher, in the high mountains of New Mexico) favors dense, particularly first growth, fir forests. Although not yet rare on the West Coast, the owl is losing some of its prime habitat. At this time, there is a partial moratorium on harvesting certain types of forest ecology that support the Spotted Owl. The U.S. Forest Service is using Landsat in two ways: 1) to produce a basemap (shown below with the dark green being Spotted Owl territory), and 2) to ensure that these areas are not subjected to illegal clearcutting.
Landsat and other space observation systems efficiently monitor transient ecological maladies such as insect defoliation (as you saw in the Pennsylvania “Exam” at the end of Section 1). Drawing upon your recollections from that exam, in which you learned to pick out gypsy moth defoliation, you should have little trouble in spotting the defoliation telltales in this subscene enlarged from the Landsat-1 MSS image that includes Harrisburg (just to the south):
Many ecological problems (some are actual disasters) occur within very short time frames. A prime example is vegetation fires in grasslands and forests. Monitoring from space is especially well suited to watching these fires as they occur and after they are extinguished to gauge their effects. Both those set purposely for beneficial purposes and those which are unwanted are proper subjects of this surveillance.
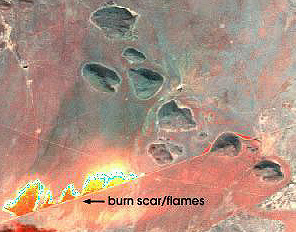
In the first category, controlled burning (including the cut and slash approach to management of crops and grasslands) on a grand scale is especially commonplace in the African savannah. We show first a pair of images made by the MODIS Airborne Simulator (MAS) (see Section 16); the one on the left simulates natural color and on the right the ability of using longer wavelength infrared to penetrate the smoke to see the actual flames.
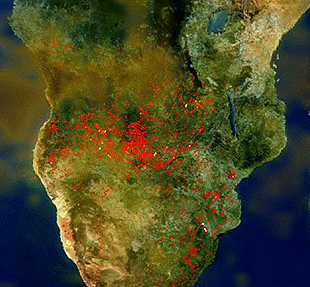
In September, 2000 much of south-central Africa was covered by major controlled fires. The image below was made using a combination of registered imagery from the NOAA-14 AVHRR and the TOMS sensor (see page 14-9).
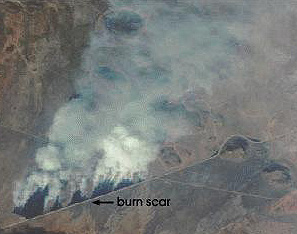
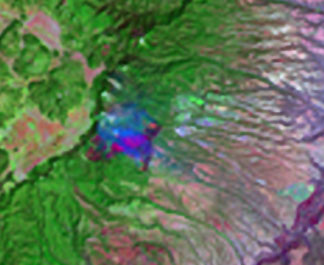
Forest fires usually burn for a few days to several weeks (especially in isolated areas) until brought under control. A fire in the Fishlake National Forest near Beaver, Utah (about 60 km [40 miles] ESE of the White-Mountain scene you will examine in Section 5), was imaged by the NOAA-9 AVHRR (1 km ground resolution), on June 17, 1996.
This false color composite was made by assigning the channel 1 image to red, channel 2 to green, and channel 3 to blue. In this version, the grayish smoke shows as yellow and the fire, at the head of the smoke column, appears as bright blue. Major fires are commonly imaged by meteorological and land-observing satellites, and the extent of the burn damage is easily assessed afterwards by the dark patterns in the visible bands. These dark patterns are usually evident as bright patches in thermal imagery because of the blackbody effect (see page 9-1).
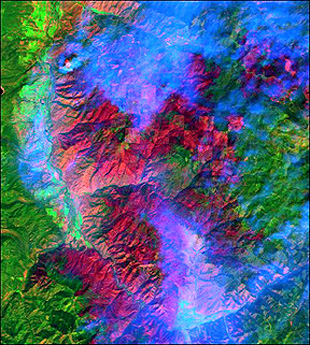
The great wildfires of 2002 in Arizona, Colorado, and elsewhere in the western U.S. were examined in the Overview. In 2000, a major fire in New Mexico consumed more than 46000 acres and destroyed 260 homes in Los Alamos, the town supporting activities at the Los Alamos National Laboratory where technology dealing with uses of nuclear energy (including the nuclear bomb which was developed there in 1945) is the principal industry. Landsat 7 captured spectacular views of this fire. The image below was made from TM Band 2 = blue; Band 4 = green; and thermal Band 6 = red. Many of the red spots in the resulting scene are actual flames or very hot burn areas.
Fire outbreaks continued through the summer of 2000 when at one time more than a million acres in 7 western states made this the worst forest fire season in more than 50 years. In mid- to late-August, the worst burning was in Montana. This Landsat TM scene shows mountainous terrain whose forests are on fire at several places; the already burned areas are in red.
Much of the U.S. has been experiencing mild to severe droughts since the late 1990s. Satellites can not only sense fires that break out but can monitor conditions that indicate the likelihood of future fires. The Fire Potential Index (FPI)uses data from meteorological and other satellites to measure Soil Moisture, which is a predictive indicator of stages of dryness in forested or grassland areas. Most fires there start from lightning strikes; some are manmade (carelessness or deliberately set. The calculated FPI for a period between July 20 and 27, 2000 is shown below:
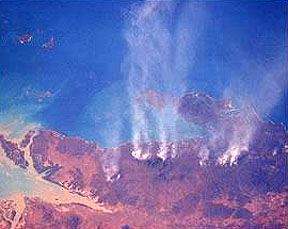
Forest fires are common targets of opportunity for astronauts and cosmonauts during their photo sessions because these are usually so obvious when seen from space. Here are fires in the tropical north of Australia:
On a wider scale of view, forest fires in three separate areas, one in Borneo, north of Java, and two in Sumatra, in 1997 were imaged by NOAA-14 (at a resolution of 4 km [2.5 miles]), as seen here:
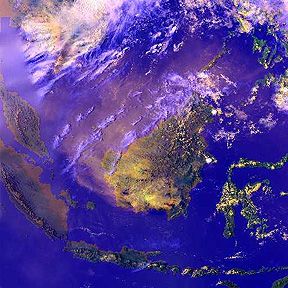
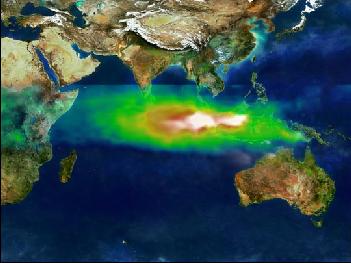
Air pollution on a grand scale is often easily visible from space. An imposing example is the mixture of smoke and smog created by fires spread over many islands in Indonesia. Using imagery acquired by TOMS, and set against a backdrop developed from NOAA data, a huge smoke plume (white), mixed with smog (colors represent variations in ozone amounts) is seen to be heading westward from the islands across the Indian Ocean.
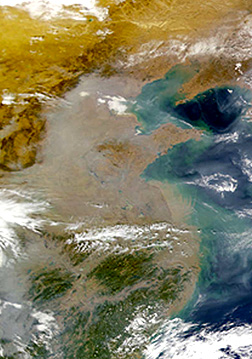
China has had many problems with widespread pollution during its rapid transition to heavy industry over much of the country. This next image, taken by SeaWIFS (page 14-13) shows a brown haze covering much of northeastern China to the extent that land surface features have been blotted out.
Natural air pollution from intense dust storms also besets China from time to time, especially when winds remove fine materials from the Sinkiang and Mongolian deserts. This MISR image pair shows a part of eastern China near the Korean border; on the left, a relatively clear day and on the right the almost total obscuration from a thick cloud of dust:
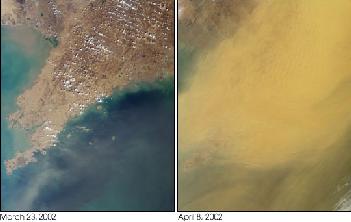
Dust storms are also common off the Sahara Desert of Africa, as is displayed by this pair of images taken two days apart:
![]()
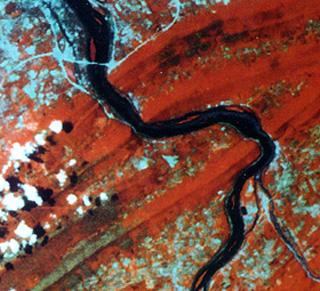
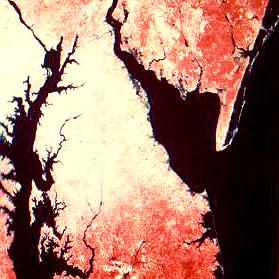
Another example of air pollution was detected just two months after ERTS-1 was launched. The area affected included Goddard Sp. Flt. Ctr., the home of this satellite. On a particular day in September the writer remembers a severe smog (pollution) alert for the Washington and Baltimore region. Later, in checking through some of that early imagery, he found an image that dramatically revealed the extent of pollution on that day. The area shown is east of these cities in the Upper DelMarVa peninsula (Easter Shore); the loss of red is due to the thick blanket of smoke (in yellow white) above the dominantly agricultural and forested terrain.
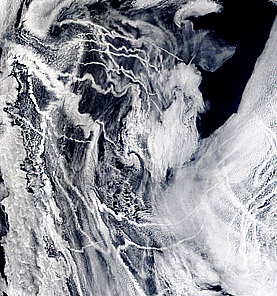
A more localized form of air pollution derives from SO2 and other gases released from smokestacks onboard ocean vessels such as freighters. This condenses along with water vapor to form cloud trails similar to those made by jet airliners. Here is such a phenomenon seen over the Pacific Ocean:
Natural catastrophes, such as volcanic eruptions, are a much feared and often unavoidable calamity to people living in proximity. We can monitor the eruption and its after effects by satellite. For instance the 1980 eruption of Mt. St. Helens, in Washington State, is quite familiar to Americans (page 12-5) The gradual plant regrowth in the ash deposits around the site has been followed over the years in Landsat imagery. Below we show a Landsat TM natural color subscene taken in August 1999. Although the gray ash is still widespread and dominant, careful inspection indicates various shades of green within the deposits where trees, bushes, and even grasses have made a substantial comeback in the two decades since eruption.

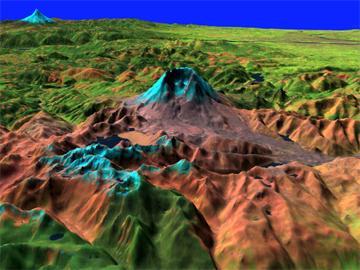
Landsat imagery combined with DEM data produces this perspective (oblique or side-looking) view of Mt. St. Helens and its surroundings; the red color helps to define areas of heavy ash fall now undergoing regrowth.
Overseas, major eruptions affecting populations seem to occur every few years. The June 15, 1991, event at Mt. Pinatubo on the island of Luzon in the Philippines is a classic example. After almost 600 years of dormancy, earthquakes around it began in April of 1991. Their increase prompted evacuation of more than 50,000 people. Just three hours before the main eruption, the AVHRR on NOAA 7 imaged the billowing clouds of water vapor mixed with ash, that foretold the impending climax. This three-band color composite shows the eruption material interspersed with clouds associated with Typhoon Yunya (left image).
`
 <originals/Fig3_37.jpg>`__
The peak eruption (right image), of the violent Plinian type, sent pumice, ash, and chemical aerosols above 12,200 m (40,000+ ft), leaving behind a 2 km (1.2 mi) wide caldera (cavity) that displaced most of the summit. Sulphuric acid was a major constituent of the aerosols that spread worldwide, affecting the weather and climate for the next five years. In the immediate vicinity, ash deposits surrounded the volcano for 20 km, destroying most of the heavy forests. That is evident in this before and after pair of images, obtained by the Multispectral Electronic Self-Scanning Radiometer (MESSR) on the Japanese MOS (Marine Observation Satellite) operated by NASDA (National Space Development Agency, of Japan).
MOS satellite; in the after (right) image, ash is shown in pinkish-red.|
` <>`__3-15: What is the broad area of pink in the “after” image?**ANSWER**
Europe’s most active volcano, Mount Etna in the northeast corner of Sicily, began a series of strong eruptions in mid-July of 2001. Lava flows (dark red) threatened villages perched astride this stratovolcano’s slope.One of its more violent eruptions was captured by a sensor on the Terra spacecraft, as seen in this image:
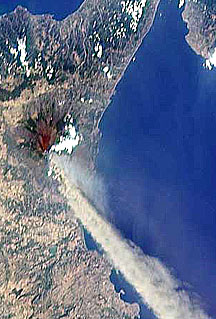
This is all we wish to say about Mt Etna now, since it will be the subject of page 13-4d which will summarize the “multi” concept.
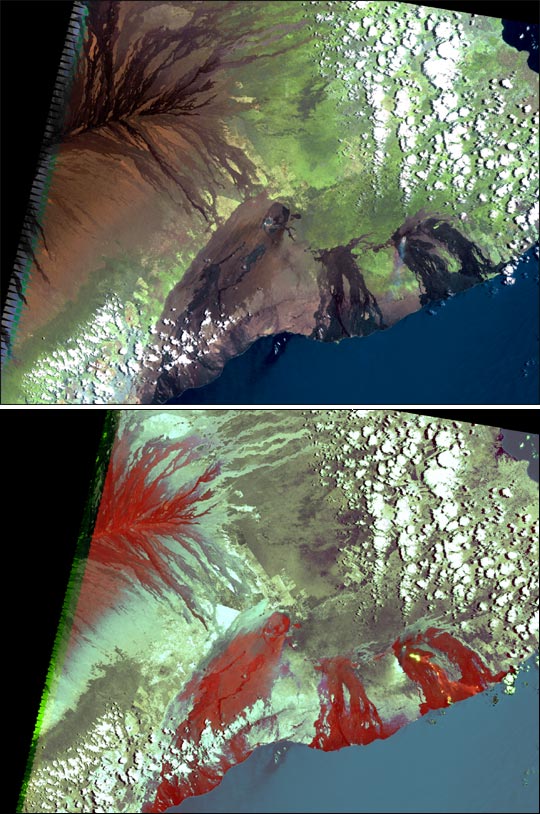
The most active volcanic area in the world is the Kilauea rift on the east flank of Mauna Loa on the big island of Hawaii (see page 17-3 and page 9-7. A more or less continuous period of eruptions of basaltic lava began in 1983. Lava has moved off island into the ocean at several points of entry, in effect building on to the land. Landsat-7’s ETM+ sensor captured these two images (top, natural color in the visible; the bottom, a thermal image processed to show the warm residual heat in the lava as a red tone). While the paths and progress of lava (typically, 300,000 to as much as 600,000 cubic meters/day when active) are closely followed by park rangers and volcanologists on the ground (thus permitting early warnings to villagers that a lava stream may come their way), the space imagery give a long term running account of the spread of lava over the years.
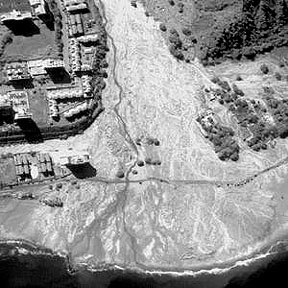
Mud flows often accompany volcanic eruptions. These, and landslides, also occur after heavy rains. A landslide/flow is depicted in detail by the IKONOS satellite for an area in Venezuela subjected to a deluge and subsequent flooding.
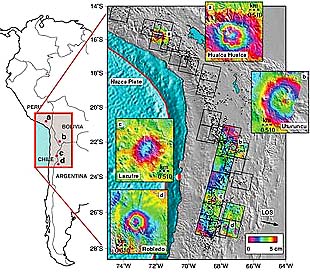
Considerable scientific manpower and money have been dedicated to discovering ways to predicting damaging and life-threatening natural events - mostly of a geologic nature. Earthquakes and volcanic eruptions lead the list. Radar interferometry (see page 11-10) offers real promise since one of its accomplishments is to be able to measure vertical ground displacements (such as occur when a volcano begins to swell upwards and outwards as its magma chamber fills) and, under appropriate circumstances, lateral (subhorizontal) displacements (as occurs along strike-slip or wrench faults). In the illustration below is evidence of ground swelling at four volcanic sites in South America as determined by analysis of 8 years of data from the radar on ERS-1 and ERS-2; while this may not guarantee an impending eruption, it does fit the pattern known to foretell many eruptions.
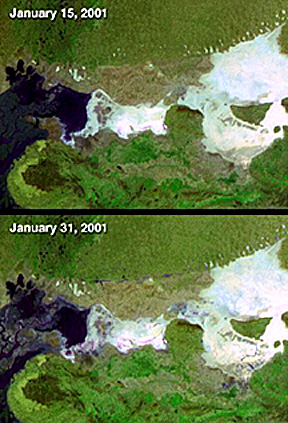
This next pair of MISR (Terra) images reveals another, quick subtle manifestation of the aftermath of an earthquake of magnitude 7.7. This, the Gujarit quake which killed more than 20000 people, took place on January 26, 2001 along an active fault line in western India. This arcuate trace just above the large white sand area on the right is visible in both the January 15 and January 31, 2001 images. Look closely at that line in the Jan. 31 image, along its left half. Small black blotches are evident - these are not present in the Jan. 15 image. They are the marks of saturated soils resulting from liquefaction releasing groundwater that seeped to the surface after the earthquake.
Turning now to water quality issues: Two telling examples show water pollution in remote sensing images. The image below, made by the Coastal Zone Color Scanner (CZCS) on Nimbus 7 (see page 14-13), shows the shallow shelf region of the Atlantic Ocean in the Long Island Bight, south of New York City. For decades, a train of barges has carried waste materials (euphemism for garbage) several times a week to an offshore dumping site. The barges move in a zig-zag pattern that leaves a distinctive curlicue pattern of pollution, which is readily apparent in this color composite image.

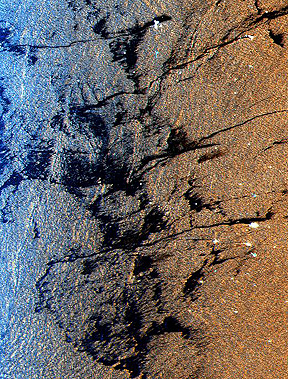
Another dreaded ocean contaminant is oil spills. Oil is noted for “calming the waters”, i.e., reducing the degree of wave disturbance, making it visible in certain bands. Multiple oil leaks in the Arabian Sea, west of Bombay, India, are obvious in the SIR-C radar image below. Their darkness is not solely due to black oil color involving light absorption but also to the decreased backscatter of the radar beam (see Section 8 for the principles).
Radar imagery, especially in the black and white mode, is very effective at locating and monitoring oil spills over their full extents. This next image, made by the radar unit on Envisat, shows how radar graphically highlights the large oil spill resulting from the breakup of the oil tanker Prestige in late November, 2002. Most of its cargo of 20 million barrels went down with the ship as it sank into deep waters. But 1.5 million barrels of oil eventually reached the northwest corner of Spain, contaminating almost 300 km (200 miles) of beach. Here is a radar image taken soon after the spill leaked out.

` <>`__3-16: Can oil spills be detected in Landsat imagery? **ANSWER**
Other types of water pollution can be detected from space. One of the first demonstrations of this is the example of waste pulp and hot water from a paper mill being dumped (illegally) into Lake Champlain from a New York site. Its effect was to reduce water wave action. The ERTS-1 subscene shown below was used in a legal court case in which a judgment against the mill owners was one by the State of Vermont. This space imagery application was given much notice in the newspapers.

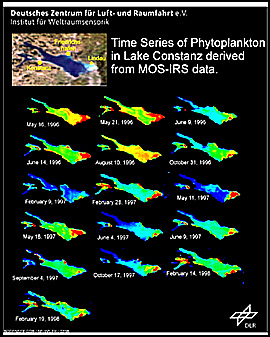
Lakes are also subject to natural variations which affect their “health” and quality. Phytoplankton are algal-like plant that can thrive in freshwater lakes, changing in quantity with the seasons. The Modular Optoelectronic Scanner (MOS) on the Indian IRS-P3 satellite was used to monitor amounts of phytoplankton in Lake Constanz (also known as the Boden See) along the Swiss-Bavarian border (in northeast Switzerland) for several years, as seen in this succession of images (time-series) from May, 1996 through February, 1998:
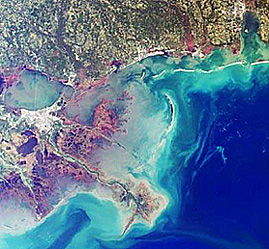
One of the major concerns about humans’ destruction of the environment is the alarming reduction in wetlands - marshes within landmasses, particularly those associated with rivers or near the coasts, that are ecological habitats for various plant species and many specialized animals (particularly birds) adapted to living in these watery conditions. Extensive wetlands tracts occur at ocean/land boundaries. One of the best known in the U.S. is wetlands and bayous along the Delta country where the Mississippi River meets the Gulf of Mexico, as seen here:
Wetlands are often deliberately destroyed to recover land for agricultural development or for home building. One of the most famous wetlands - the marshes of Mesopotamia, in Iran and Iraq - which were key factors in the rise of cultured peoples in the “Cradle of Civilizations” - has undergone drastic draining and dessication in just the last 30 years. Below are montages made from Landsat imagery in 1972 (top) and a 1997 RESUR image (bottom) of an area where the Tigris and Euphrates rivers meet around Shatt-al-Arab. Damming of the rivers and deliberate diversion of their waters have reduced the marshlands that once covered more than 20000 sq. miles to now less than 4000 sq. miles.
1997.|
This land reclamation was done largely to increase available land use for Iraqi development around Basra and the port of Umm Qasr where oil from the Rumaila fields is shipped to tankers plying the Persian Gulf. When the second Gulf War took place, it was feared that the Iraqi forces would blow up dams upstream to reflood the marshes. This did not happen. Here is a satellite view of central Basra, Iraq’s second city (about 1,000,000 people):
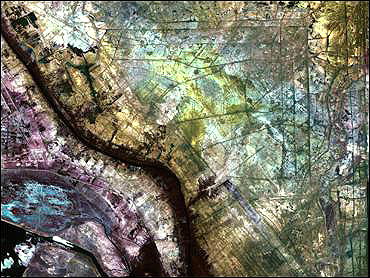
Similar to our clearcutting examples already examined above, satellite systems can follow long term changes in resource use, such as strip mining and the progress of land reclamation (again, in the Pennsylvania case study). This is evident in the image below, which shows strip scars (light to medium blue), replanted areas (red stripes), and farmland in the coal measures of western Maryland (Allegheny Plateau). The image was made by the Linear Pushbroom Radiometer (LAPR) developed at Goddard Space Flight Center as a prototype to test the CCD array concept and flown on a NASA aircraft.

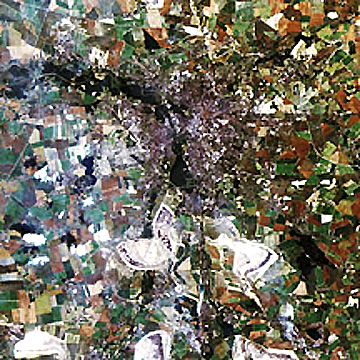
As a transition image to the next Section, the TM scene below shows an urban area near Leipzig in Germany, surrounded by numerous large fields, both fallow and with diverse crops, and several large white areas (those being clouds have associated shadows) which are the unfilled and poorly reclaimed scars of major surface pits from which soft coal was dug out for heating and power production in the past.
We will illustrate other agricultural, forestry and ecological applications in this Tutorial (several appear in Sections 6, 13, 16, and 17). The text will introduce more of the possibilities that space imagery affords in monitoring and inventorying crops, grasslands, forests, wetlands, and other ecological niches. But, now let’s take leave of the countryside and rural settings to examine another contrasting use: cities and related land-use patterns, as satellite sensors can depict them.
Primary Author: Nicholas M. Short, Sr. email: nmshort@nationi.net