ERBS; UARS; ADEOS
Contents
NASA has always played a key role in conducting basic studies in meteorology from space. It is usually joined in these efforts by NOAA and by university researchers. One-time only special missions, using sensor systems developed for specialized measurements, have been flown. Three of these dedicated programs are described on this page: ERBS; UARS; ADEOS (a Japanese satellite with sensors from NASA, NOAA, and other contributors); Earth Probe.
ERBS; UARS; ADEOS
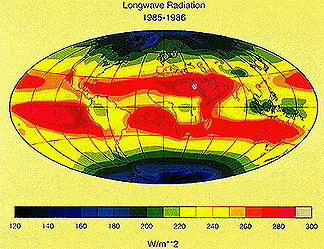
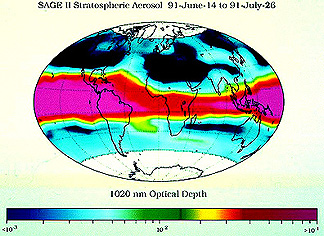
Similar to some of the first metsats, several U.S. missions in the past 14 years performed atmospheric/climate research, primarily. On October 5, 1984, the Earth Radiation Budget Satellite (ERBS) went into a non-synchronous orbit that permitted sampling at various times of day. The ERBS consisted of two instruments: a scanner and a non-scanner, designed to measure diurnal variations of incoming solar radiation and its differential absorption by the atmosphere. The latter had five broadband channels, one looking sunward, and the others at Earth, over wavelength intervals of 0.2-5.0 µm. The scanner’s three channels performed similar functions. The ERBS also carried Stratospheric Aerosol and Gas Experiment II (SAGE-II), a limb sounder, which used four bands (0.385, 0.45, 0.60, and 1.0 µm) to measure aerosol and Rayleigh (fine-particle) scattering, whenever the satellite could view sunrise and sunset in its orbit. The next image is an ERBS determined, long-wavelength, radiant-flux density during 1985-86.
Here we show aerosol concentrations over a period of six weeks, during summer 1991, as measured by SAGE-II. Note: these instruments flew on other satellites, including two in the NOAA series.
` <>`__14-22: What were ERBS and SAGE actually measuring?`ANSWER <Sect14_answers.html#14-22>`__
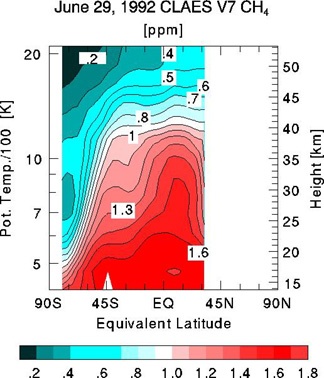
` <>`__14-23: Where does the methane (CH:sub:`4`) concentration appear to be maximum? Speculate on why. `ANSWER <Sect14_answers.html#14-23>`__
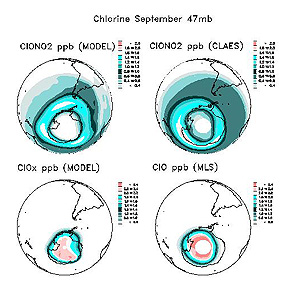
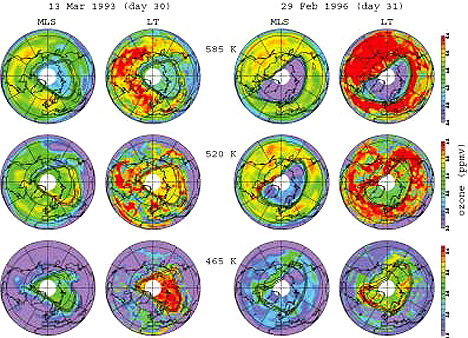
Among the many gases studied by UARS is ozone (O:sub:3), of which much attention is being paid to the so-called Ozone Hole at each Pole because the depletion of ozone can have serious consequences to health (loss of ozone increase the risk of damage to life by solar UV rays). This set of maps shows variations in ozone in the Arctic region as detected by UARS’ MLS instrument in wintertime during two dates three years apart; the distribution is at different elevations in the upper atmosphere as indicated by temperatures (degrees Kelvin):
UARS is a good example of the use of multiple sensors to study the properties of a single target medium, in this case the atmosphere. As such, it is a precursor model of the use of multisensors to monitor the Earth’s diverse environments, as is being done now in the EOS Terra and Aqua programs (Section 16). A worthwhile review of UARS is found at its Home Page.
The Advanced Earth Observation Satellite (ADEOS) is a Japanese spacecraft, launched on August 17, 1996 and renamed by them as MIDORI, to conduct land, sea, and atmospheric studies using ten instruments supplied by NASA, NOAA, NASDA (Japan) and CNES (France). Sadly, this versatile satellite failed on September 12, 1996 but not before sending back some excellent, proof-of-concept data.
It is now becoming common to piggy-back sensors from several nations on a given satellite. Among ADEOS sensors are a NASA Scatterometer (NSCAT), discussed on page 14-12. Another NASA instrument is TOMS (Total Ozone Mapping Spectrometer), developed at Goddard Space Flight Center. Besides ADEOS, TOMS has flown earlier on Nimbus 7, Meteor-3 (Russian), and since ADEOS on Earth Probe (see below). Here is one of the few TOMS maps from ADEOS.
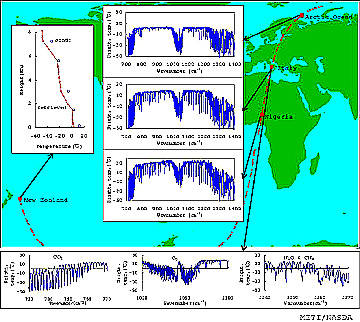

` <>`__14-24: Is it reasonably safe to fly in a jet with respect to ozone as a contaminant? What are the horizontal green bars in the right diagram? **ANSWER**
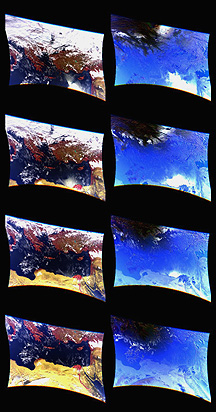
Another ADEOS instrument, developed by the French, is POLDER (Polarization and Directionality of the Earth’s Reflectance). It includes 8 channels in the Visible and Near IR and can take images from different directions. It has a polarimeter that allows polarized light properties to be assessed. The image set below shows part of the Mediterranean in 4 successive views on the left and polarized light components (dominated by blue from scattering) on the right.
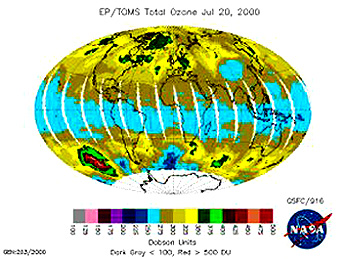
The early loss of ADEOS meant that one satellite monitoring ozone was no longer able to supply this critical data set, first collected in 1978 by the TOMS instrument on Nimbus-7. Fortunately, continuity was preserved by the launch in 1996 and continuing operation of Earth Probe (EP) which included a TOMS. The next image was taken the day before this was typed (July 20, 2000):
The previous week, the EP TOMS produced a neat image of dust storms raging in North Africa and the Near East. Here, TOMS was measuring aerosols associated with the dust storm:
covering North Africa, the Near East, and Europe; imaged by TOMS on Earth Probe.|
Next up in the TOMS series will be Triana, scheduled for launch in 2002; it will have 10 narrow bands over the interval 0.317 to 0.870 µm.