Additional Agriculture Examples in SW Kansas and Morocco; Vegetation in Wetlands
Contents
Two more SPOT scenes, and two Landsat images, are examined mainly for their agricultural information content. The first, in Kansas, introduces an unusual, but now fairly common practice, that of pivot irrigation, recognizable by the circular field patterns. The second, in the western plains of Morocco, shows a variety of field crops in various stages of growth during a pair of observations two months apart. Differences in the degree of “redness” in the false color composites indicates the extent to which certain crops have matured. Examples of change detection using ratioing and temporal differencing are also presented, using data from the U.S. Southwest and England.
Additional Agriculture Examples in SW Kansas and Morocco; Vegetation in Wetlands
We turn momentarily to a second SPOT subscene (10 km [6.2 mi] on a side), taken on May 11, 1986, over an area near Garden City in southwestern Kansas, a major wheat producing area in the Great Plains agricultural belt. The most striking feature is a series of circular patterns ranging from less than 0.4 to about 0.8 km (1/4 - 1/2 mile) in diameter (about the same sizes as the Kenyan farm plots). Some people are astounded when they see these features from an airliner flying across the Midwest. `
<originals/Fig3_11.gif>`__
|
These fields have an effective
innovation for watering known as
center pivot irrigation systems.
Center Pivot Irrigation System, Northern California, Mount Shasta in the Background |


The system uses a long water pipe that is mounted on motorized wheels and has one end connected to the water line at the center of the field. When operating, the irrigation system swings in a circle,sprinkling water as it rotates. (Several fields actually show a dark linear radius which is this interesting system.) The red circular fields are mostly plantings of winter wheat that are nearing harvest. Those circles in various shades of blue (note the darker patterns of moisture) are fallow at this time, but most of them have probably been seeded for spring wheat, or will be. Note the road patterns that outline squares. These roads follow survey lines that coincide with the one-mile squares, representing sections in the American Township and Range surveying system. The worm-like red pattern within a section in the upper center is an 18-hole golf course, which appears in the middle of nowhere (compare it with the one in the Morro Bay scene).
In some parts of the U.S. Great Plains, circular fields become the dominant type of agricultural pattern. This is strikingly illustrated in this Landsat subscene of a part of southern Nebraska:

` <>`__3-7: What is an obvious disadvantage to the circular irrigation system? `ANSWER <Sect3_answers.html#3-7>`__
Our final SPOT agricultural scene is actually two images of the same area, obtained two months apart during late winter and spring in northwest Africa. The purpose here is to illustrate changes in vegetation as the crop calendar progresses. The area is the Ghard plains, not far from the Atlantic coast in western Morocco, near Casablanca. This granery belt is a main producer for that country. The crops include beets, sugar cane, wheat, and rice.
Monitoring growing crops is an excellent example of using multidate imagery for change detection. Let’s start by looking at the SPOT Band 1 (green) image (above) acquired on March 14, 1986. A first reaction may be that the landscape is mostly farmland, with almost all plots being smaller than in the Kenyan and Kansan scenes. The next obvious characteristics are the small river (Oued Oum er Rbia) and the major roadway to El Jadida on the west and Settat on the east, met by several feeder roads. Note also some very dark areas in the image.
These dark areas are nearly black in Band 3 (IR) (the left image from below). They are probably bodies of water, with some being irregular in shape that represent standing water from spring floods and others in field-like shapes are probably irrigated rice fields. Only a fraction of the fields (particularly along the river) are rendered in bright tones, indicating that most crops are not growing much yet.
|
SPOT image of the Ghard plains, Morocco - Band 3 (IR), May 10 1986.|
|

But, when the same area is imaged in SPOT Band 3 on May 10, (the bottom, left image from above) a much larger percentage of fields are in brighter tones, suggesting many crops are growing. The black areas of flooding are reduced, but rice fields remain about the same tone. The image shows towns in medium-gray tones. Tiny bright patches dot the one in the center, indicating numerous trees.
The pronounced differences in the extent of active crop and tree vegetation, are much more evident when comparing false color images first for the March scene (left) and then the May scene (right).
|
|


In the March image, an estimated 30% of the fields have actively growing crops, while in the May image, this increases to about 80%. The areas of open water in the March scene greatly diminish in the May scene. Some of the areas with water show up as dark red (typical of rice fields) in the May view. In the March scene, a large part of the land not in crop growth appears in a dark brownish-green color which in false color is the expression of soils that are naturally reddish-brown.
` <>`__3-8: There is at least one town in this scene, maybe more. Where? **ANSWER**
Image-processing techniques for change detection can help to emphasize major distributions of active versus dormant, or absent, vegetation. One simple approach is to make a ratio image (divide the DNs of one image by the other ) using the same bands, usually in the IR, for two dates. This results in very bright tones wherever vegetation is prevalent in the dividend’s date but not in the divisor’s date. (See page 1-15 for explanation of ratioing) The opposite is true if the vegetation distribution is reversed because the dates are reversed. If vegetation is present to similar extents on both dates, the ratio image tones will be moderately gray. We attempted to do a ratio image on IDRISI for the March and May scenes but failed because the two scenes did not coincide. The images were taken on dates when the orbits were not exactly aligned. Co-registering images requires a computer algorithm that can execute a “rubber-stretch fit”). IDRISI, while it can generate ratio images, does not have a simple program for co-registering (aligning) two closely related images where one is slightly offset from the other (it can do certain kinds of registration).
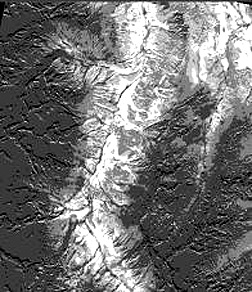
To illustrate how well vegetation can be made to stand out by ratioing, we substitute here a same date TM Band 4/Band 3 image of an (unidentified) area in which a valley is heavily vegetated (appearing whitish in the ratio image) and the adjacent plateau is mostly rock and soil (dark).
Still another change detection approach is to register two scenes acquired on different dates and then subtract the DNs of one from another. Below is a TM image of fields near Leicestershire, England. This is a difference image showing fields that have either no crops or different crops in various shades of gray.
Another vegetation-rich environment which benefits considerably from satellite and aircraft monitoring by remote sensors is the general category of Wetlands. These are water-rich impoundments as lakes, etc. or natural bodies of water at and in from the edges of ocean shores, lakes, or winters. Depending on whether the water is saline (salty seawater) or fresh, there will be a biotic assemblage that is characteristic of the particular conditions of growth. The monitoring is interested mainly in the shrinkage or expansion of the wetlands water and in the health and abundance of the supported vegetation. Often wetlands will follow a natural course that tends towards drying up as sediment fills the depressions holding the host water or the supply of water diminishes, or vegetation becomes so abundant as to supplant the water. Another, ever more common now, cause is the deliberate draining of the wetlands by humans bent on reclaiming the area for farming, housing, recreations, etc. We shall show the ability of remote sensing to determine the characteristics of wetlands from satellites.
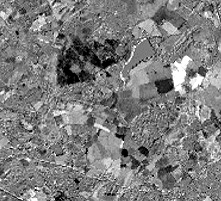
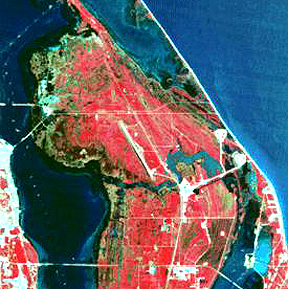
First up is this subscene from a Landsat TM image showing part of Cape Canaveral on the east-central coastline of Florida. Note the area (with brownish tones) in the upper left quadrant. This is a mix of brackish (less salty than ocean water) water and land plants that are typical of this area.
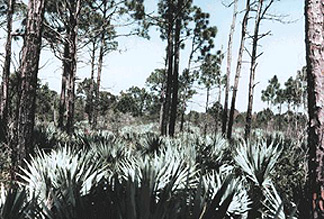
The two dominant land plants are loblolly (slash) pines and palmetto plants, as seen is this ground photo.
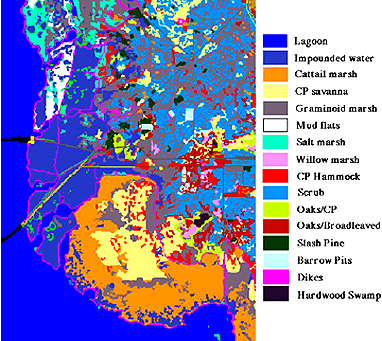
This is the supervised classification of the small land bulge seen in the Landsat subscene
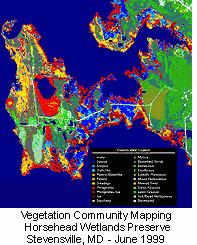
This next illustration has been degraded in the reproduction process, with the legend unreadable, but it indicates the amount of information leading to feature/class identification possible from an aircraft-mounted hyperspectral sensor. It is a classification of a neck of land tied to an “island” jutting into the Chesapeake Bay near the Bay Bridge on the eastern shore of Maryland.
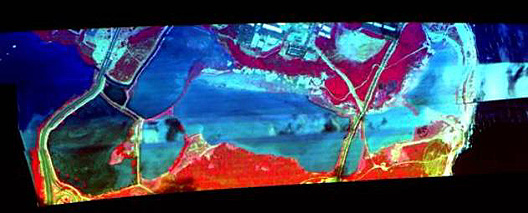
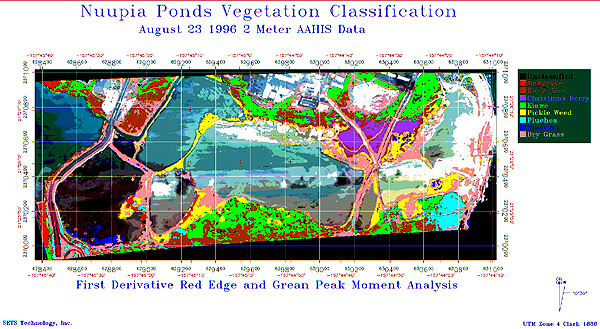
A hyperspectral sensor system, AAHIS, built and operated by International Science and Technology, Inc. has 228 very narrow bands in the spectral range from 0.437 to 0.840 µm. Flown from an airplane, it also achieves high spatial resolution. Here is a false color image of the Nuupia Ponds on Kaneola Bay, Oahu, Hawaii. Beneath it is a specialized classification that distinguishes and most classes present in the scene