Forest Applications
Contents
In terms of areal extent, the vast majority of vegetation that shows up in images acquired by satellites is not agricultural but forests (and grasslands). Some regions, such as the Tropics, display green, active vegetation all year round; others, such as temperate (humid) and boreal, do not appear as reds in the false color mode during the dormant season. Deciduous trees can usually be differentiated from evergreen-dominated forests. Globally, the amount and variety of vegetation cover changes with the seasons. On this page, examples of tropical and subboreal forests in the Amazon and Canada are presented. Removal of forest cover by clearcutting is also illustrated for both regions. Classification and biomass estimates are touched upon.
Forest Applications
Let’s switch attention now to the world’s forests, natural and planted and maintained for future harvesting. The distribution and condition of these forests, along with other principal types of vegetation in the global biosphere, can be determined and refined periodically, by analyzing Vegetation Index data acquired by satellites. As an example, here is a plot of the distribution of general forest classes, as they were identified in AVHRR data from NOAA 7 and 9 metsats. Colors that are not identified in the legend include red = shallow, coastal or inland waters; blue = ocean waters; purple = deep ocean; black in the arctic and antarctic regions = not classified.

` <>`__3-12: Which continent appears to be most widely vegetated; least widely? **ANSWER**
One obvious application lies in determining the geographic and areal distribution of major types of sylvan vegetation and their ecological settings. Generally, Landsat and other remote sensing systems can readily distinguish between deciduous and coniferous forests, and can recognize shrublands, savannahs, and various desert ecosystems. But, identifying most tree types at the species level is much more difficult, unless high resolution images are available and the trees have distinctive crowns and leaf shapes that produce fairly explicit spectral signatures. Easier tasks, that have widespread applications, involve discerning defoliation - either in the extreme with tree removal by clearcutting or through denuding trees of their leaves by insects, and assessing forest fire or storm damage.
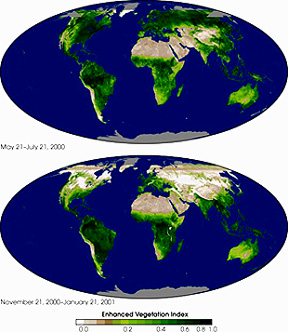
We all know from experience that vegetation cover varies seasonally. This reaches maximum differences in active growth in the higher latitudes (and altitudes) and is less changed in the equatorial and tropical regions of Earth. Here are two global vegetation cover maps made from MODIS data, with the growth data collected over time frames of weeks:
The Amazon Rain Forest; Deforestation
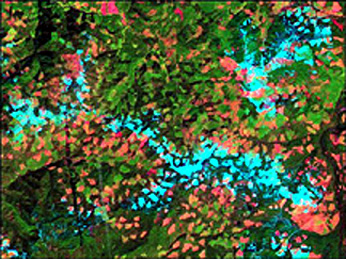
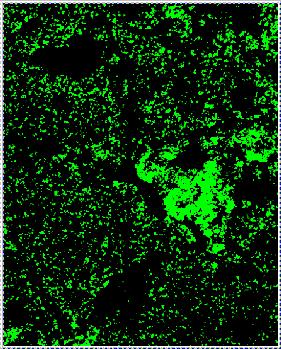
Clearcutting in parts of the world has become a major problem and is the subject of much environmental concern, because of habitat destruction and biochemical threats to the atmosphere. Clearcutting disturbs the balance between the oxygen and carbon dioxide produced and used in photosynthesis. The systematic attack on rain forests in the tropics, to provide open land for farming and other development, is currently the greatest source of alarm. The top concern is for the vast jungles of the Brazilian Amazon, which transition into savannahs at their edges. Over the years, farmers, ranchers, and other entrepreneurs have cleared about 200,000 square miles (about 10%) of the 1.93 million square miles in the Amazon Basin. Fortunately because of an outcry from the rest of the world, the rate of removal is slowing somewhat. Radar data from the NASA Scatterometer (NSCAT) (see page 14-12) operating over South America shows (below) the distribution of several general, land-cover classes in the Amazon. In this image-based map, rain forest appears in blue/purple, woodlands and savannah in green or yellow, and farmlands or undeveloped mountain lands in black.
rainforest stands out from other surface features and is displayed in purple-red.|
This next Landsat TM image is a natural color composite that dramatically illustrates the uniformly dense tropical forests. These forests are the largest continuous tract of thick woodlands anywhere on Earth - and provide a haven for diverse plant and animal species, which are now threatened with destruction.
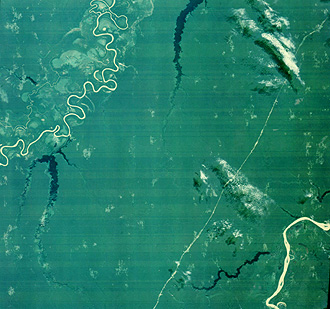
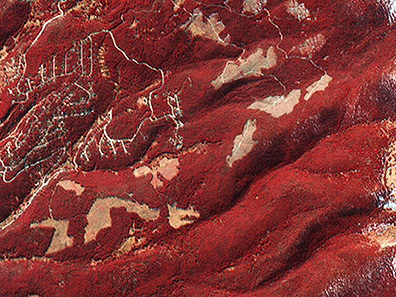
One of the most active programs for converting rain forests to cultivated land persists within the State of Rondonia in the southwestern Amazon. In fact, this area is justly cited as the prime example of land stripping. The next three images support this conclusion. The first (left) image is a Landsat TM subscene taken in 1986. The neat rows or strips in blue are cleared land amidst the surviving forest. In the right image is a Synthetic Aperture Radar (SAR) image taken by the Japanese JERS-1, in which areas of clearcutting show in red.
|
|


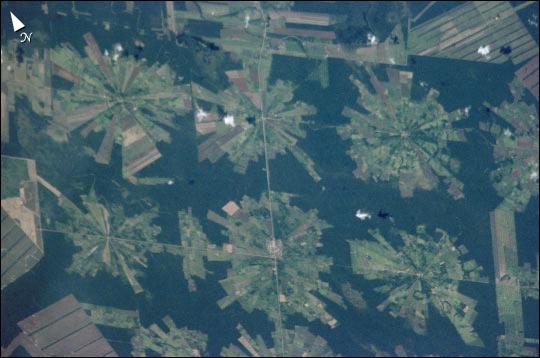
The rectangular forest stripping pattern is common. Another pattern, which could be called stellate, involves deforestation outward from a common center, as shown in the astronaut photo of an area in eastern Bolivia.
Radar imagery, which can penetrate cloud cover (see page 8-5), is especially effective for short-term monitoring of changes in deforestation. This next image (courtesy of NASDA) uses two JERS-1 SAR images taken 15 months apart to pinpoint the enlarged edges of cleared strips. Preserved rain forest is shown in white. Deforestation as of July 1992 appears in yellow, and additional stripping up to October 1993 is marked in red. While the changes are not gross, the encroachment on remaining natural forests is obvious

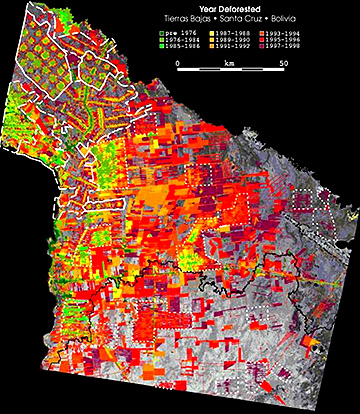
Over the last 30 years, imaging of the rain forests of South America from various satellites has accumulated a lot of history about deforestation as it progresses. This next image uses color coding to indicate removal and some reforestation in the Tierras Bajas jungle in the Santa Cruz region of eastern Bolivia:
` <>`__3-13: Make a guess as to the percentage of South American rainforest that has been cleared or defoliated. **ANSWER**
At a smaller scale, but nevertheless subject to continuing debate, is the stripping of whole tracts of woodlands in temperate and boreal forests to provide lumber and paper pulp. Loss of the redwoods in the western U.S. coastal forests is a typical situation. While current laws require reforestation of most of these lands, the rate of regrowth in some regions is not keeping pace with removal. Some of these forestry applications are nicely portrayed with several Landsat subscenes (below) of heavily timbered areas of Canada, as prepared by the Canadian Centre for Remote Sensing. The first two cover an area near Port Renfro on Vancouver Island in British Columbia, in part of the Pacific Coastal Ranges with fir, spruce, and some deciduous trees. In this next subscene are a pair of TM images, each 7 x 15 km (4.3 x 9.3 mi), taken on July 17, 1984 (left) and June 19, 1991.
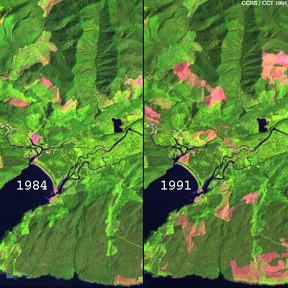
Each is processed with TM Band 3 = blue, Band 4 = green, and Band 5 = red. This color scheme makes active vegetation green. Clearcutting of the mixed forest in the year or so before 1991 is in pinkish-red. Mature vegetation is darker green and regenerated forest appears in light green.
` <>`__3-14: Estimate the increase in clearcutting from 1984 to 1991. **ANSWERS**
Another way to carry out this change detection is to use two bands from one year and one band from the other year in making the color composite. Note this combination in the following image:
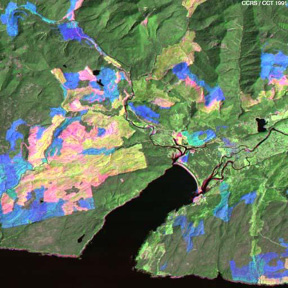
In this 15 x 15 km (9.3 x 9.3 mi) version, TM Bands 4 and 5 from 1984 are assigned to green and red, and Band 5 from 1991 is shown in blue. Once again, mature forest is rendered in dark green and reforested land in light green but here pink denotes areas that were recently deforested in 1984 and blue refers to areas that were clearcut between 1984 and 1991 but have yet to make a strong recovery.
We shift now to part of the boreal forestlands that are widespread on the Canadian Shield. The area (15 x 15 km, 9.3 x 9.3 mi) is in an isolated timber wilderness near Lac Nemiscau in northern Quebec:
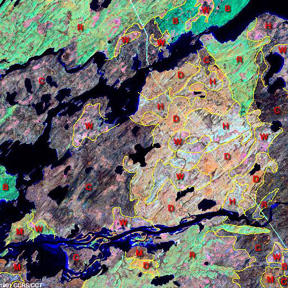
In this August 20, 1991 subscene, TM Bands 5, 4, and 3 have been assigned to red, green, and blue, respectively. The Riviere de Rupert and associated water offshoots appear in black. Shades of bright green are areas of recent, partially recovered fire burns (B in red lettering) or regenerated forest (at R). Purple-gray denotes coniferous forests (at C) and orange is deciduous forest (at D). Small areas of wetlands and bogs (at W) show as pink; M refers to mixed forest, and H indicates heath (evergreen shrubs, similar to Scottish heather) with trees. Try to pick out the power line running to the north. This false color rendition is almost as graphic and definitive as a supervised classification,because of the incorporation of the longer wavelength, TM Band 5.
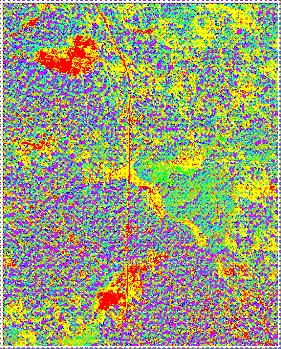
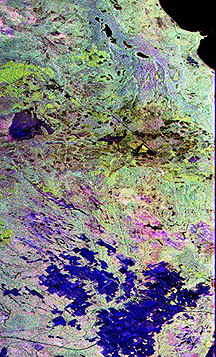
Staying in Canada which has a vast area of boreal forest, let’s look at another multitemporal example of change as monitored by the multiple bands on SIR-C radar:
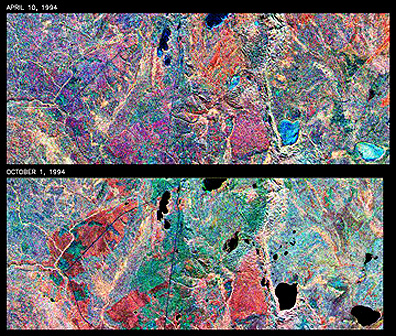
There are notable changes between April and October of the same year. In April Old Jack Pine is purple but red in October; Spruce and Aspen are red and green in April and blue in October. A small clearcut area made during the summer is also blue in the October image.
Terra is contributing in many ways to better our knowledge of forests and other vegetation biomes. It, too, provides striking images of deforestation. Perhaps no other part of the U.S. shows the nature and magnitude of clearcutting than the Cascades (and nearby Coast Ranges) in the Pacific Coast states. Here is an ASTER image that shows recently clearcut forests in red (not the actual color of the denuded land, but chosen to emphasize their widespread location). Replanted earlier clearcuts appear in light green while old forest is in darker green; the blue is residual snow surviving into this May, 2000 subscene.
With the advent of high resolution space imagery, details of the clearcuting can now be deciphered for small areas. This IKONOS-2 image is of the Copper Mountain area of the Colorado Rockies. With its 4 m resolution, a texture defined by individual evergreens can be made out. Logging roads and cleared sections are readily defined for easy mapping.
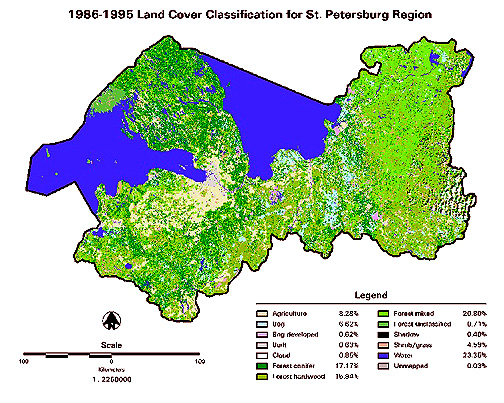
By now, the question should have crossed your mind as to how well individual tree species (and the individual trees themselves) can be identified by various remote sensors and data processing techniques. For Landsat, the answer is generally “not well at all” because of resolution. Generally, at lower resolutions dark evergreens can be separated from deciduous trees in temperate and boreal ecosystems. Broad categories of vegetation and other land cover types have been classified with some reliability as indicated in this illustration which shows a fair number of categories - most vegetation-related - in the region around St. Petersburg in Russia.
An unsupervised classification of a forest area imaged by the Landsat TM yielded the result shown in the left image below. When ground truth was added to the process, one of the classes proved to be aspens. A new map in which just the aspens are located, as shown in green, proves that some individual tree speciation can be reliably determined.
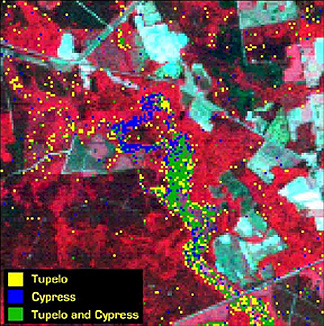
Again, as was true with crops, high resolution imagery greatly improves the ability to identify and locate individual tree species. In this IKONOS 4 meter subscene of a forest near Charleston, South Carolina, individual Tupelo and Cypress trees, and a class of the two mixed, have been pinpointed by classification.
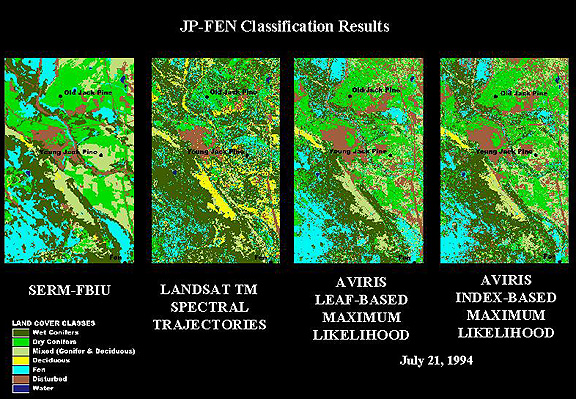
Perhaps the best example on this page of the efficacy of remote sensing to classify vegetation and other ground cover types is this series of images showing a forest in Canada that contains conifers (mostly Jackpines), deciduous trees, and fens (bogs). On the left is a map made from ground and aerial photos. Next to it is a surprisingly good Landsat TM classification. The right two images are made from AVIRIS data; the left one is based on using the Leaf Area Index values and the right uses the NDVI to calculate the classes.
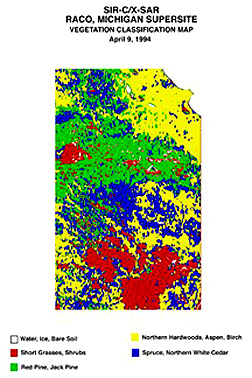
We close this forestry subsection with a SIR-C investigation of a NASA Supersite at Raco, Michigan on the Upper Peninsula next to Lake Superior. The host Shuttle was STS-59 which flew in April, 1994. The target area was heavily forested, as seen in the multiband color composite:
The blue area is mostly cleared fields. Light greenish-yellow marks red pines; brownish-yellow denotes jack pines, and purple locates deciduous trees.
Using ground truth and other information sources, the above image was classified as shown in the left illustration below. Estimates of biomass, using field data and a mathematical model, are shown in the right illustration.

Both Visible-NIR and radar images have met with moderate success so far in estimating biomass in forests, grasslands, and crops. The degree of success is strongly influenced on the quality of ground truth and the specific model used. But as higher resolution imagery and better models are developed, these results should improve significantly.
Finally, there is an esthetic side to watching tree foliage from space. In Fall, New England is famed for its marvelous colors, bringing millions to witness this panorama of visual beauty. Such imagery helps TV Weather commentators in advising residents in their listening area as to the optimum times and places to view the countryside. This Terra MISR image pair of northern N.E. (western Maine into New Hampshire and eastern Vermont) almost true color views of foliage in late August 2000 when the forests were near their height of greeness (left) and past their peak - most leaves are now dropped - in mid-October 2000 (note how the defoliation allows some of the underlying geologic structure to be exposed):

Let’s also look at a companion MISR image showing southern New England. Here, being further south, the image shows more of a red tone, in keeping with the fact that the leaves (red and yellow in color) have not yet fallen.

Primary Author: Nicholas M. Short, Sr. email: nmshort@nationi.net