TIMS Thermal Scenes: Death Valley; Mauna Loa
The Thermal Infrared Multispectral Scanner (TIMS) was developed by NASA-JPL as an airborne prototype for an eventual spaceborne sensor of similar capabilities. It divides the 8-14 µm thermal interval into 6 bands. The airborne version, with its high resolution proved capable of actually identifying some individual minerals and many rock types. Images from Death Valley, California taken both day and night clearly show a strong correlation with geologic materials at that test site. A day TIMS image of lava flows on Mauna Loa, Hawaii proved able to distinguish different flows owing to varying degrees of weathering between younger and older rock units.
TIMS Thermal Scenes: Death Valley; Mauna Loa
Now we turn to a powerful thermal sensor: an airborne instrument known as TIMS, for Thermal IR Multispectral Scanner, operated for NASA by JPL. Ground equivalent resolution is 18 m (59 ft). As its name indicates, TIMS breaks the 8-12 µm interval into six bands: (1) 8.2-8.6, (2) 8.6-9.0, (3) 9.0- 9.4, (4) 9.4-10.2, (5) 10.2-11.2, and (6) 11.2-12.2 µm wide. From these bands, we can produce three-band color composites by various combinations of bands. Although broad, these gather varying amounts of spectral thermal energy that we can relate to more discrete (narrower) absorption features associated with minerals that occur in rocks and soils.
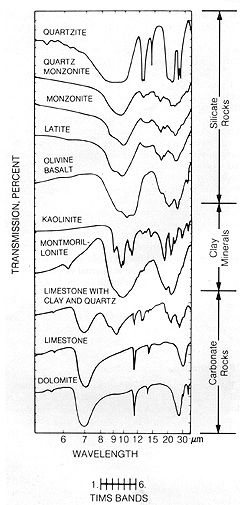
From Kahle (1984), Figure 4 in F.F. Sabins, Jr., Remote Sensing: Principles and Interpretation. 2nd Ed., © 1987. Reproduced by permission of W.H. Freeman & Co., New York City.
` <>`__9-13: What do the silicates and clay minerals share in common? What distinguishes a quartzite (a cemented sandstone dominated by quartz [SiO:sub:`2`]) from a monzonite (a granitic rock with quartz and feldspars, and perhaps some mica)? How do the carbonates differ from the other rocks in the above plot?`ANSWER <Sect9_answers.html#9-13>`__
TIMS has flown over many test sites, of which, one of the most informative extends across part of Death Valley in southeastern California. Here the Great Basin meets the Mojave Desert to the south. The Earth’s crust breaks along tensional faults, allowing segments to downdrop into basins bounded on either side by mountain ranges. As these ranges wear down, debris flows into the basins, partially filling them. Death Valley occupies such a structural basin, within which is the lowest point in the Western Hemisphere (86 m or 282 ft below sealevel). Once largely covered by lakes, the valley is now one of the driest and warmest spots on Earth, with summer temperatures often exceeding 120 °F.
Next, we show part of a LANDSAT Thematic Mapper false color composite of the northern end of Death Valley.
The high mountain block on the left is the Panamint Range, made up of complexly folded and faulted Paleozoic sedimentary rocks. A small segment of the Funeral Range appears at the upper right. The valley contains playas (deposits from ephemeral [usually dry] lakes) and salt pans. Saline deposits, formed from evaporation of intermittent stream waters, include sodium borates (source of the borax hauled out by the famed 20-mule teams) and sulphates, gypsum, and rock salt, mixed with mudstones, carbonates, and floodplain sediments. Water today is at a premium, but note the red patch (a golf course!) at Furnace Creek, headquarters for the Death Valley National Monument, located at the edge of a large alluvial fan with active, vegetated distributaries (shown here in an aerial photo).
the east side of Death Valley.|
The effect of rainfall runoff over the millenia is especially evident in the numerous other alluvial fans spread over the valley pediment surfaces. These fans formed when mountain streams dropped their loads, because their gradients abruptly lowered upon entering the valleys.
A TIMS daytime overflight along an E-W line on August 17, 1982, highlighted several of these arid landforms. We examine separate images made from Bands 1, 3, and 6 and a color composite of these. The TIMS aircraft executed a nighttime flight over the same areas shortly thereafter. We display the three daytime images here side by side: The red letters refer to specific features that are listed in the table below.
|
|
|
Band 1 |
Band 3 |
Band 6 |
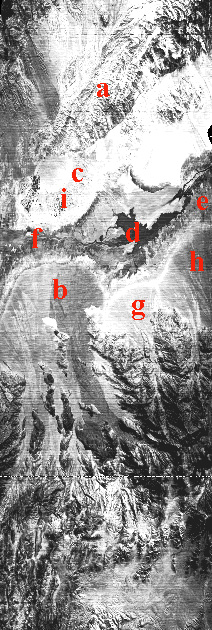

We oriented the above images with north on the left side of each. The area covered is approximately that of the lower right quadrant of the Landsat subscene shown above. Visible in each is an outlier of the Panamint Range (bottom right) and a small segment of the Black Range (top right), two prominent alluvial fans (lower), the conspicuous dark and light fan on which Furnace Creek resides, darker alluvial fill in the basin, and the sharply contrasting light tones of salt deposits. At first glance, the three bands seem similar to one another in their general tonal distribution. But, when comparing equivalent points, subtle to sometimes notable changes in tone are clear. Compare these tonal patterns with those from the night thermal IR overflight, seen here:
|
|
Nighttime TIMS images, Bands 1, 3, and 6, of approximately the same scene as in the daytime images shown above; Aug 17, 1982.|
|
Band 1 |
Band 3 |
Band 6 |

Next, examine the day and night color composites made from these bands:
Color composite of daytime TIMS view of the Death Valley test site; Band 1 = blue; 3 = green; 6 = red.|
|
|
Day Composite |
Night Composite |
Day 1 3 6 CC Night 1 3 6 CC a. Mountains m-d m- d m-d mixed l-m l- m l-m mh-h b. West Fans m m&d m-l h m m l h c. Furn Crk Fan l l- m m vh d d d c d. Dark Fill m m m- d mh l l l- m mh e. Salt 1 d d d c - vague - - f. Salt 2 l m l- m w - - - - g. Interfan l l l- m h l l m h h. Fan Rim m-d m- l d w l m-d d mc i. Golf C. m-d m- d d c-mh - - - - Code: A. Day - l = light (tone); m = medium; d = dark B. Night c = cold (blue); m = moderate (green); w = warm (yellow); h = hot (pink to red);
v = very hot (white)
A few comments may help to these concepts sink in. As one would surmise, the mountains (a) show variegated tones and colors because of the variations in slope, aspect, elevation, rock types, and other factors. The large fans (b) stand out in moderate to light tones and are hot in the day and the night scenes. The fan at Furnace Creek **** (c) appears in lighter day tones and dark in all night bands. Thus, it is quite hot in the day composite and very cool in the night composite, which we expect from loose, unconsolidated materials that readily gain, then lose heat. The darker valley fill (d) absorbs heat in the day and retains it at night. The peculiar-looking salt deposit at e, easily separated in the visible Landsat image, has a dark daytime pattern and cool color in the composite. The saline area at the end of the Furnace Creek fan is less well defined and appears warm in the composite. Neither saline area (e and f) shows clearly in the night band and composite images. A darker fan on the west side, referred to as interfan (g), is as warm or slightly hotter than the fans on either side. Its darkness (black body effect) infers a higher radiant temperature. The deposits just beyond the western fans (h) make up a band in the Landsat image that displays moderately well in the day thermal images, being in darker tones. They are even more noticeable in the night images, as dark tones. The golf course is not obvious in the day image and indiscernible in the night image, but its mottled pattern probably results from grass on the fairways.
The above TIMS scenes are part of the data set acquired by JPL for their Death Valley Test Site. From those data, they also prepared a larger-area TIMS scene that is much publicized. We reproduce that scene here, noting that they made it by assigning TIMS 1 = blue, 3 = green, and 5 = red. Again, observe that alluvial fans appear in reds, lavender, and blue-greens; saline soils in yellow; and other saline deposits in blues and greens.
larger part of the Death Valley test site.|
` <>`__9-14: Locate the Furnace Creek fan (c) in each image, day and night, and also the fan labelled “b”. Describe the differences between the two fans, and try to account for these. `ANSWER <Sect9_answers.html#9-14>`__
Verification of the ability to discriminate and identify materials by the multiband thermal IR approach demonstrated by TIMS, using a space-based system of similar capabilities, is evident in this next image - a display of the Death Valley region imaged at night and draped in a DEM-developed perspective view in which these three ASTER (Terra; page 16-10) thermal bands: Blue = Band 10 (8.3 µm); Green = Band 12 (9.1 µm); Red = Band 13 (10.6 µm).

The salt deposits in the central valley - mostly halides, with some nitrates, sulphates, and borates, are rendered in yellow, purple, pink and bluish-green. The high mountains, such as the Panamints, composed of carbonates and shales, with some sandstones and metamorphics, are colored as greens. The prominent reds along uplands flanks are the stream deposits ending in alluvial fans; this unconsolidated debris is enriched in silica (such as quartz sand grains) produced through weathering.
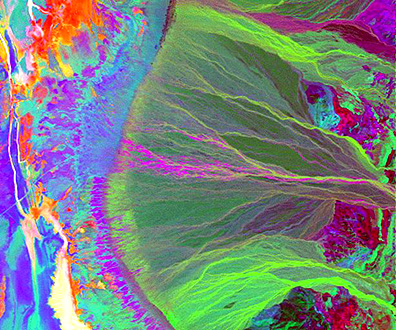
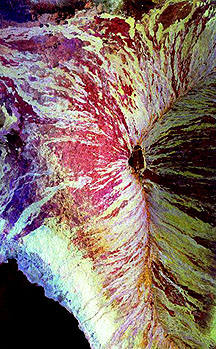
While it is a departure from the thermal theme of this Section, we append here a colorful and informative image of a small part of Death Valley made by performing a Principal Components Analysis of AVIRIS hyperspectral data (see Sections 5 and 13) collected at D.V. A large number of individual narrow bands were utilized in making the PCA image constructed from the first three Principal Components;
Another TIMS image superbly reveals the power of thermal remote sensing. The scene below extends across a series of solidified basaltic lava flows coming from the great shield volcano Mauna Loa on the big island of Hawaii.
Most of the distinguishable flows have emerged from the volcano at various times in the last 200 years. The thermal differences sensed, as displayed by the selected colors, are due to several factors: variations in the glassiness of the original flow; variations in surface textures and porosity; variations in degrees of weathering (mainly as a function of age), which are expressed in part by subtle differences in the color imposed by surface alteration. In visible light, all these flows tend to be dark in reflectance because of their inherent blackness, but their radiant temperatures vary because of the above factors.
` <>`__9-15: In trying to determine the relative age of each flow with respect to the others, what other factor will help in determining the sequence? `ANSWER <Sect9_answers.html#9-15>`__
As we noted in Section 8 (Radar), surface roughness plays a role also in the reflection of radar pulses, such that degrees of roughness - and thus differences in volcano flow types - give rise to distinctively different signatures. SIR-C imaged much of Mauna Loa in October of 1994, showing the many different flows, some of which are just those in the TIMS image above. In the image below, the radar color composite is made from L-band HH = red; L-band HV = green; and C-band HV = blue. According to the published interpretation by JPL, pahoehoe flows (ropy) appear as red and smoother flows as yellow to white (the writer [NMS] believes some other color(s) may correspond to aa flows (chunky). In any event, radar can distinguish flow types but for different reasons than thermal sensing. Compare this image with that shown on page 17-3.
TIMS was developed and proof-of-concept tested with the intention of flying something similar to it in space, as, for example, on the Shuttle (which has yet to happen). However, a multichannel thermal sensor is part of the ASTER sensor system on the ESSE program’s Terra (see page 16-10). Here is an image of the Afar area in Ethiopia, put into color using these three ASTER bands: Band 10 = Blue; Band 12 = Green; Band 14 = Red. The scene is 60 by 60 km (~ 40 x 40 miles) wide; resolution is 90 meters. Reds indicate rocks high in silica; blues and purples denote lower silica content (basalts).

ASTER is effective at pinpointing active, hot lava flows as we saw earlier at Mount Etna. Here is a series of Band 14 ASTER images of a continuing flow from the Kilauea volcanic rift on the Island of Hawaii, obtained between May 13, 2000 and January 1, 2001. The date of each image is listed in the caption.

Primary Author: Nicholas M. Short, Sr. email: nmshort@nationi.net