20. Design and implementation of layer tree functionality in WebGIS
20.1. Background
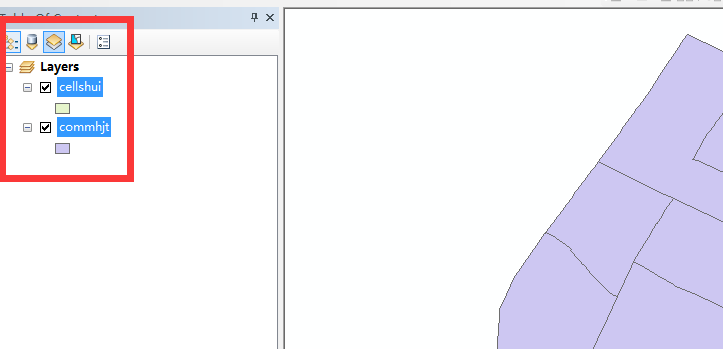
In GIS desktop tools such as arcgis desktop or Supermap Tools such as desktop will have layer control bar tools, known as LayerController. By checking the layer selection box in the layer control bar, you can achieve whether a layer is presented, and so on, and you can also set the relevant properties of the layer.
The detailed requirements are as follows:
a.Layer list presentation
b.Control the presentation of layer features with a list of layers
c.Supports setting some properties of layers
20.2. Design
a.The display of the layer list will depend on the relevant tables or profiles in the database, increasing flexibility.
b.The presentation of layer features can be made in two ways, one in which WMS requests a picture overlay and one that gets the feature information to draw on the front end.
c.When you set properties, you can keep only databases or profiles, and properties can include business properties or layer visual ranges, layer visual levels, and so on.
20.3. Acquisition and implementation of layer list information
The information in the layer list should correspond to the layer information in the published service. Different services, the way layer information is obtained is different. Here I am divided into two modules to describe.
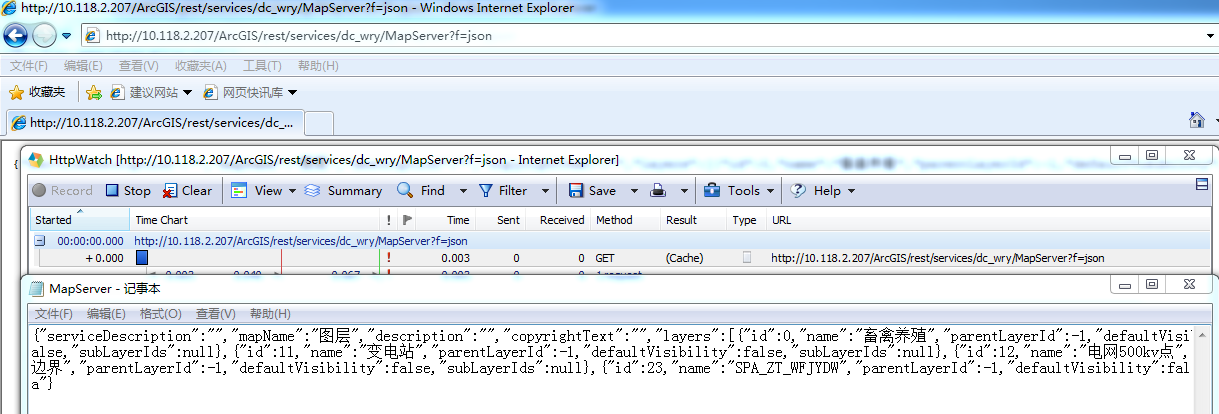
20.3.1. Get layer organization information in ags
After Ags publishes the service, the returned layer information can be obtained through the service root request. This information contains the organization structure, name, and layer number of the layers in the service. The information is parsed and saved to the relevant profile, synchronizing the front-end presentation with the published service.
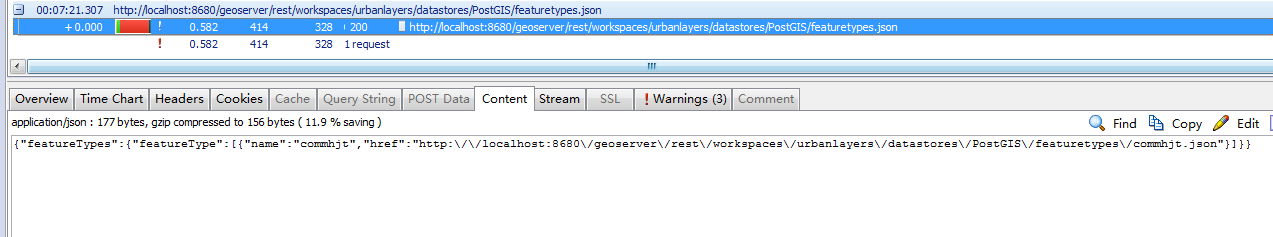
20.3.2. Geoserver gets layer organization information
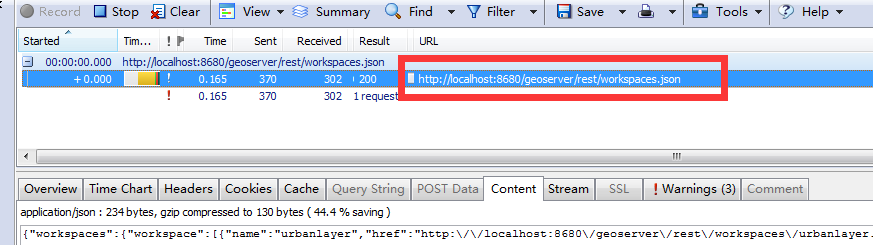
Geoserver gets layer information in two ways, one by using Geoservermanager and the other by using a direct way to get geoserver services. Here I focus on the latter.
Get workspace information:
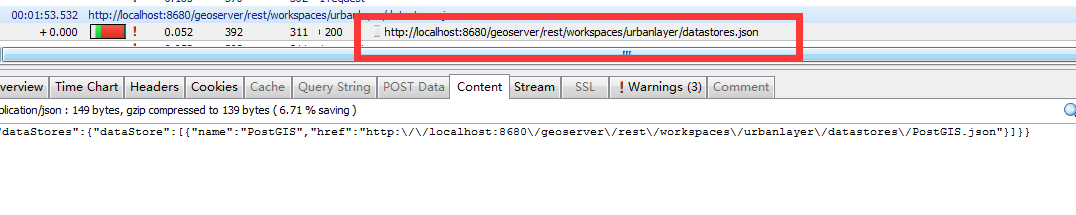
Get datasource information under workspace:
Get the layer information in the datasource under the workspace:
20.4. Implementation of layer feature presentation
When a layer in the layer list is clicked, the layer features need to be displayed at the front end. Here I am divided into two categories to describe.
20.4.1. WMS-style request, picture-mode presentation
1 WMS request in AGS (export)
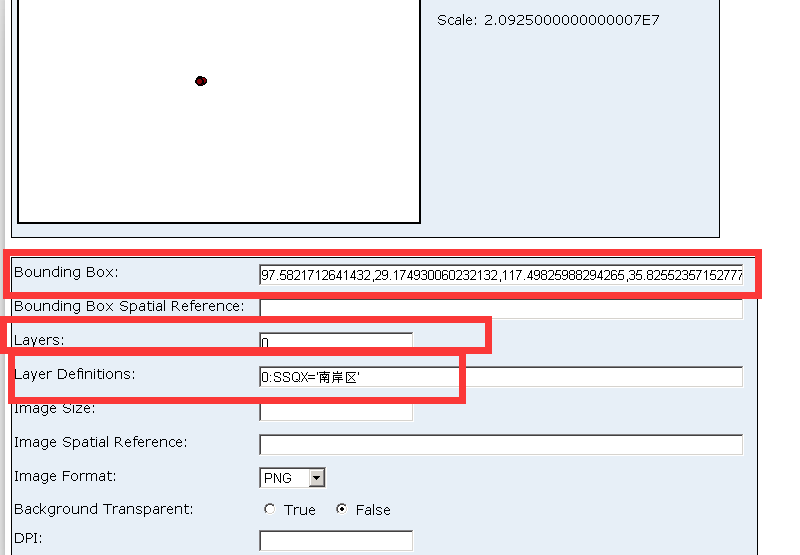
Layer feature presentation filtering is available through Bbox, Layers, and Layer definitions.
2 WMS requests in Geoserver
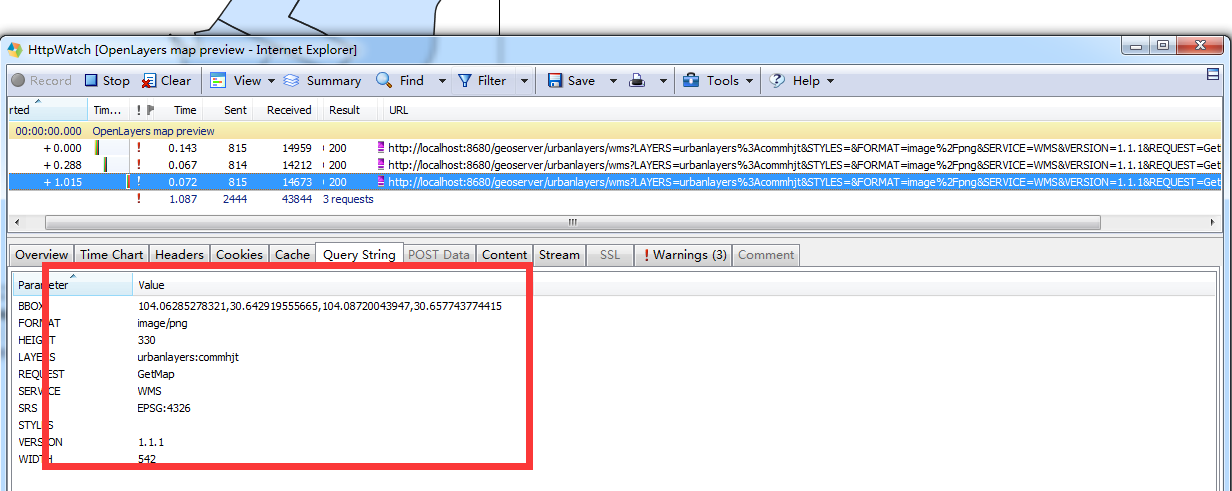
You can set the size range of the graph, etc. by parameters.
20.4.2. Based on the return edit, the front-end drawing is displayed
Send a request to the background to get all the feature information that meets the criteria, and the front end resolves the information and draws it. This approach is better in terms of interaction, but has a load on the front end.
20.5. Summary
From the bottom layer, the basics of the WebGIS series have been basically finished here. In this series, I explained in detail the tile location algorithm, online and offline map URL stitching format, front-end raster layer and vector layer design, map. Zoom in and out, I query and other related functions. In the following series, I will also discuss with you how to do path optimization, how to achieve cluster display, how to solve big data display and so on. Welcome everyone to continue to pay attention.