Decision Making: Suitability Determination
This page begins with a quick look at some of the major Internet GIS sites that offer you much more insights into how GIS works, along with links to many organizations that deal with services and products or present case studies. Then, the main topic turns to one aspect of the decision-making process, using as an example the numerical evaluation of several thematic maps in terms of optimal conditions related to critical factors involved in choosing a site for a hypothetical project. These are combined into a suitability map in which the highest scores designates the best potential sites.
Decision Making: Suitability Determination
http://www.gisdevelopment.net/tutorials/index.htm
We embark now to further explore what GIS does, how it works, what software systems are available, and what typical end products and applications look like. Before moving on, you may wish to gain further insights into GIS by visiting sites on the Internet. One way is to work through some of the entries found through a Web Search Engine. We have picked out a few of the better ones whose links are given here. First, look at a site developed by an (unidentified; but the author is listed as Dr. Shunji Murai) Japanese source found at this Web mirror site. Geographers at the U.S. Geological Survey prepared the second site, which they call the GIS Tutorial. Another useful summary is found at the GIS Development site. The leading U.S. software providers are ERDAS with its Imagine and Leica Geosystems programs and ESRI, which also offers training courses. ESRI has produced a glossary appropriate to GIS, accessed here (Glossary). A general overview of GIS is found at GisPortal. Lists of GIS organizations and links can be accessed at GIS Resource List and GIS links. (Note: please recall from your own experiences in surfing the Net that many links become inactive - or just disappear. Six such links in an earlier version of this Tutorial has vanished. Those cited above were valid as of July 1, 2000. E-mail the writer if you find a link has failed.)
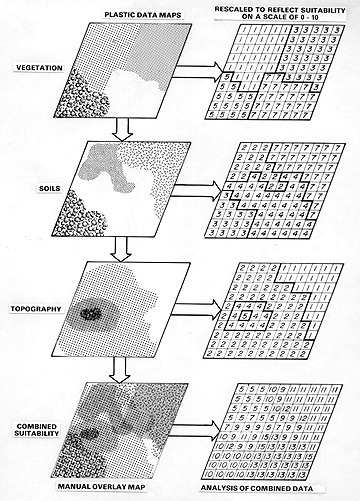
Suppose that three factors or variables, among the attributes that describe a geographic area under consideration, are essential in determining best sites for, say, a land development venture: Vegetation, Topography, and Soils . A data element on a map represents each variable. In this case the map shows the characteristics and distribution of the members or classes within the element theme, e.g., different types of soils and their properties.
Primary Author: Nicholas M. Short, Sr. email: nmshort@nationi.net