Conducting a GIS Analysis
` <>`__
Conducting a GIS analysis is best done by following some appropriate set procedure. The logic and strategy of this are described on this page. Some numerical data can be entered into a database consisting of tables or other non-image formats. But maps normally will have to be digitized or scanned. The usual steps in carrying out a GIS study for practical applications are set forth in this page.
Conducting a GIS Analysis
From B. Davis, GIS: A Visual Approach, ©1996. Reproduced by permission of Onword Press, Santa Fe, NM.
Many organizations have developed software packages for GIS analysis. The most widely used are ARC/INFO (Unix and Windows NT platforms) and ArcView (a smaller PC desktop version) marketed by the Environmental Systems Research Institute (ESRI) of Redlands, California, a company founded in 1969 by Jack and Laura Dangermond. Shane Murnion of Queens University in Belfast, created a tutorial for using ARC/INFO (http://boris.qub.ac.uk/shane/arc/ARChome.html). Another program, called GRASS, was developed by the Army Corps of Engineers and, although they no longer support it, you can learn about this tool at Baylor University’s GRASSLINKS.
The following flow diagram outlines a general system design for procedures and steps in a typical GIS data handling routine:
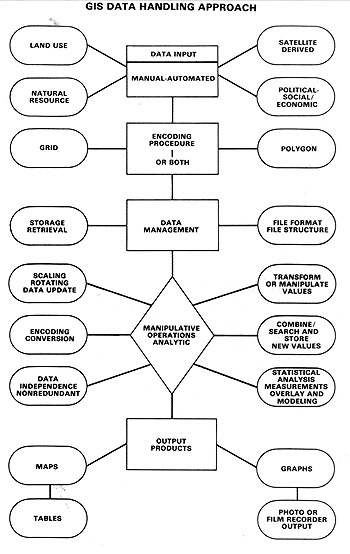
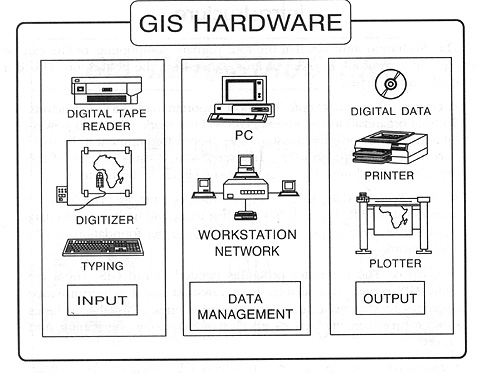
The objective in this operation is to assemble a data base that contains all the ingredients to manipulate, through models and other decision-making procedures, into a series of outputs for the problem-solving effort.
` <>`__15-12: In the diagram above, one of the entries in the data input end is satellite imagery. Make a list of some of satellite-derived observations that lead to information relevant to GIS analysis. `ANSWER <Sect15_answers.html#15-12>`__
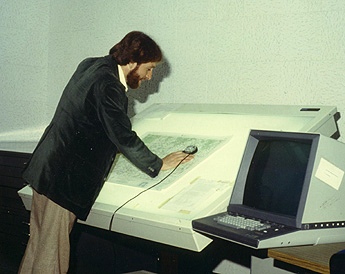
Behind this table, on which we mount a map, are closely spaced electrical wires arranged in a grid that we can reference as x-y coordinates. The operator (here, Bill Campbell, Chief, NASA GSFC Code 935, who authored the chapter on GIS in the Landsat Tutorial Workbook) places a mobile puck with centered crosshairs over each point on the map and clicks a button to enter its position, along with a numerical code that records its attribute(s) into a computer database. He then moves to the next point, repeats the process, and enter a tie command.
Any map consists of points, lines, and polygons that locate spots or enclose patterns (information fields) that describe particular attributes or theme categories. Consider this situation that refers to several fields (e.g., different types of vegetation cover) separated by linear boundaries:
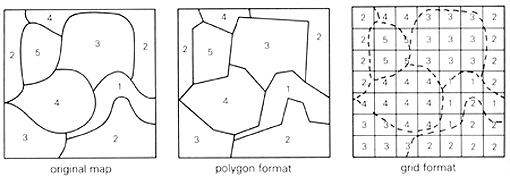
` <>`__15-13: In the above diagram, by visual inspection, decide which of the two geocoding methods seems to be more accurate. `ANSWER <Sect15_answers.html#15-13>`__

From B.Davis, GIS: A Visual Approach, ©1996. Reproduced by permission of Onword Press, Santa Fe, NM.
Each point has a unique coordinate value. Two ends or node points define a line. We specify a polygon by a series of connecting nodes (any two adjacent lines share a node), which must close (in this writer’s experience with digitizing, the main pitfall is that some polygons don’t to close, and we must repeat or repair the process). We then identify each polygon by a proper code label (numerical or alphabetical). A look-up table associates the code characters with the attributes they represent. In this way, we can enter all the map fields that are large enough to be conveniently circumscribed, and their category values, into a digital database.
In the raster approach, we manually overlay or scan onto the map a grid array of cells, having some specific size. As shown in the right panel (grid format, above), an irregular polygon then includes a number of cells, completely contained therein. The system records these cells’ locations within the grid and a relevant code number for each data element assigned to them. But some cells straddle field boundaries. A preset rule assigns the cell to one or the other of adjacent fields, usually related to a relevant proportion of either field. The array of cells that comprise a field only approximate the field shape, but for most purposes the inaccuracy is tolerable for making calculations.
Generally, grid cells are larger than the enclosed pixels in pictorial map displays, but the cluster of pixels within a polygon approximates the shape of the field. The relation of cells to pixels makes this raster format well adapted to digital manipulation. The size of a cell depends partly on the internal variability of the represented feature or property. Smaller cells increase accuracy but also require more data storage. Note that multiple data layers referenced to the same grid cell share this spatial dimensionality but have different coded values for the various attributes associated with any given cell.
` <>`__15-14: From a data handling viewpoint, particularly involving computer manipulations, which method of geocoding, vector or raster, should be easier to process? `ANSWER <Sect15_answers.html#15-14>`__
Data management is sensitive to storage retrieval methods and to file structures. A good management software package should be able to:
Scale and rotate coordinate values for “best fit” projection overlays and changes.
Convert (interchange) between polygon and grid formats.
Permit rapid updating, allowing data changes with relative ease.
Allow for multiple users and multiple interactions between compatible data bases.
Retrieve, transform, and combine data elements efficiently.
Search, identify, and route a variety of different data items and score these values with assigned weighted values, to facilitate proximity and routing analysis.
Perform statistical analysis, such as multivariate regression, correlations, etc.
Overlay one file variable onto another, i.e., map superpositioning.
Measure area, distance, and association between points and fields.
Model and simulate, and formulate predictive scenarios, in a fashion that allows for direct interactions between the user group and the computer program.
Developing a GIS can be a costly, complex, and somewhat frustrating experience for the novitiate. We stress that data base design and encoding are major tasks that demand time, skilled personnel, and adequate funds. However, once developed, the information possibilities are exciting, and the intrinsic worth of the output more than compensates for the marginal costs of handling the various kinds of data. In plain language, GIS is a systematic, versatile, and comprehensive way to present, interpret, and recast spatial (geographic) data into intelligible output.