GEOGRAPHIC INFORMATION SYSTEMS (GIS)
Contents
` <>`__
Applied remote sensing is (or can be) a key component in various types of decision making. As an example, consider how one goes about the process of converting now vacant natural landscape into an extensive living community: this includes housing developments and shopping and service centers plus sites for industry and transportation and utilities infrastructure. Much of the information needed is in the form of thematic maps (soils stability; topography; proximity to roads, etc.) and various data sets (land ownership; sources of water; local economy, etc.). Over the past two decades, a new systematic approach to gathering, storing, and manipulating the different information types, with the objective of analyzing the tasks and making and implementing decisions, has become highly popular and widespread in use: this is the methodology intrinsic to what is known as GIS or Geographic Information Systems. Remote sensing plays several roles - an obvious one is to upgrade certain maps that are outdated by classifying the most recent scene content into classes needed in any GIS analysis. This Section will explain in some detail the functions of a GIS analysis, will show how imagery like Landsat can be a vital part of the process, and will use two applications to illustrate the general end results sought. The first page focuses on some types of thematic maps in common use.
GEOGRAPHIC INFORMATION SYSTEMS (GIS)
Maps and Attributes
Throughout this Tutorial, we have presented photos and images of the Earth’s surface and clouds, some accompanied by maps that locate, classify and describe objects thereon. All these objects share a common characteristic: they are visual, miniaturized representatives, or surrogates, of places and classes of features located geospatially on or above the surface, be it land or water. They thus depict aspects of the local, regional, or global geography, which we can locate geometrically in an x, y (horizontal), and z (vertical) plot. We can reference the plot, then, to some form of coordinate and projection system. A map projection is a specific way of transferring points or locations from a spherical globe onto a scaled-down flat surface (the map) according to a systematic, orderly realignment, using a latitude/longitude grid network.
Photos (images) and maps are inherently two-dimensional or planimetric, although we can use techniques, such as contours or shading, to present a quasi-three-dimensional appearance or to extract information about relative elevations above generalized datum planes. The most common type of three-dimensional map is the topographic map, which we already examined in Section 11 (page 11-1). As we noted in Sections 10 and 11, maps in general nearly always have the following, essential information: graphic distance measures, scale, orientation and direction, projection type, and some geographic coordinate system, along with other descriptors and symbols in an accompanying legend. Topographic maps also have contour intervals.
` <>`__15-1: What type(s) of map is/are the average citizen likely to encounter in everyday life? `ANSWER <Sect15_answers.html#15-1>`__
Maps are manmade derivatives of photos and images, designed to record information of various kinds about the spatial distribution of the specific categories of features present on the surface. We also refer to these categories as attributes, which are general descriptors that are inherently non-spatial (they depend on characteristics rather than the location). A parcel of land, regardless of size, likely contains a diverse mix of features or characteristics that we can assign to different categories; in other words, it has many attributes. A category can also be a theme. For instance, we may need a wide variety of thematic maps to fully describe the contents of a surface. Thus, given an area of, say, one square kilometer (or one square mile), one such map may display road networks, another vegetation cover, a third dwellings or functional buildings, a fourth engineering properties suited for excavation, and so forth. We may combine several themes on a multipurpose map, such as roads, buildings, recreational areas, etc. One common type of map shows land cover, which identifies an appropriate class or category that we may display within the map scale limits at selected points or locations. A variant of this map is the land use map that differs by detailing aspects of the cover involved in, or of interest to, human activities.
` <>`__15-2: Think of (and list) at least four other types of specialized thematic maps. `ANSWER <Sect15_answers.html#15-2>`__
|Examples of maps depicting types of land cover in part of Washoe County, Nevada (Reno): left = Slopes; center = Soils; right = Vegetation. |
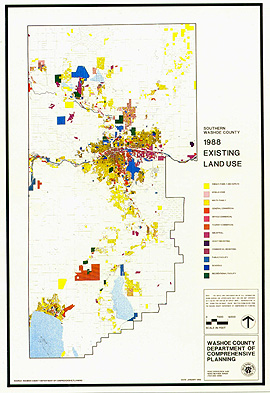
` <>`__15-3: Suppose you decided you wanted to live near Reno, but you are now residing in the eastern U.S. Your great Uncle has died and left you a piece of land. Explain how you could use the above 4 maps, even though “in absentia”, to make an educated guess as to problems you might encounter in building a house, so you can start planning even before you get there. `ANSWER <Sect15_answers.html#15-3>`__
` <>`__* Parts of this Section have been freely adapted from Activity (Chapter) 7 of the Landsat Tutorial Workbook; that activity was prepared in 1981 by Mr. William J. Campbell, current Branch Chief of Code 935, the initial sponsor of the present Tutorial.
Primary Author: Nicholas M. Short, Sr. email: nmshort@nationi.net