Unmanned Lunar Landers
Contents
We continue with the results from a new class of moonprobes - the landers. The Soviets were the first to set down intact and transmit TV pictures of the immediate site area. The U.S. followed with its Surveyor program: Of 7 attempts to land, five succeeded. Instruments on board determined the properties of the surface materials including a partial chemical analysis. The second part of this page describes how the Moon is mapped using basic geological techniques. The objective was to establish distinctly different deposits that could be treated as stratigraphic units. The law of superposition (“the younger material lies atop older”) worked well. But a new principle was also applied: Relative ages could be estimated well with counts of crater frequencies: older units had more craters per unit area.
Unmanned Lunar Landers
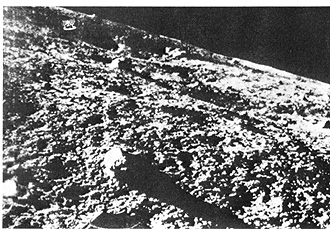
Extraordinary as these orbital photos were at the time, NASA scientists had much more to learn about the surface from a close-up vantage. Landing a viewing and sampling system on the surface was a high priority in pre-Apollo days. The former Soviet Union achieved this first with their Luna 9, in early 1966, as documented in this view of the rock-strewn surface of the mare lavas in Oceanus Procellarum.
The U.S. quickly followed in May of 1966, when Surveyor 1 touched down in the western Oceanus Procellarum. Shown below, the instrument module rested on four pod-footed legs. Surveyor’s TV camera provided pans of the immediate site and nearby features.
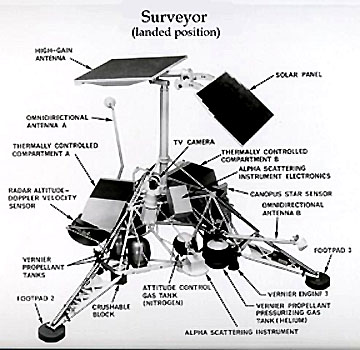
The retractable scoop could dig into the surface soil (regolith) to retrieve samples for analysis. It also answered an important question: Is the soil firm enough to support heavy landers of the future? This was visually confirmed by pictures such as this:
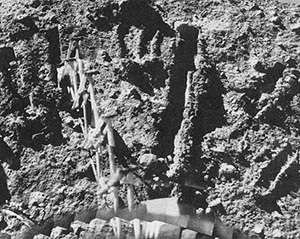
Surveyor 1 obtained close-up views of some individual larger rocks, such as shown below. This rock shows mottled dark and light patches that, based on Apollo sample returns, suggest it to be a lunar breccia containing both highlands and mare rock fragments.
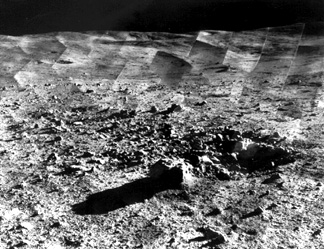
Four more Surveyors (out of seven) successfully landed. None sank, as feared, into weak surface materials. Surveyors 3 and 7 had an extendable pantograph arm that served as a soil mechanics surface sampler. Surveyors 5, 6, and 7 had magnets to collect metallic particles. The image mosaic below shows a panoramic view at the Surveyor 7 site:
They also carried alpha-particle backscatter instruments to sense outputs from certain elements (Fe, Ti, Na, Al, and Mg). The first solid evidence of feldspar as a primary constituent of the highlands came from Surveyor 7’s analysis of its immediate vicinity. Here is a chart of chemical data for Surveyor 7’s sampling of the area near Tycho:
|Plots of the atomic percentages of 8 elements detectable by Surveyor 7�s alpha particle backscatter instruments. Equivalent average values for some rock types measured on Earth are shown for comparison. |
` <>`__19-13: Comparison of the VII results with these common igneous rock types show that none of the latter really fit (come close to) that of the Surveyor’s analysis of highlands materials. How might this be explained? `ANSWER <Sect19_answers.html#19-13>`__
` <>`__19-14: Summarize the principal results (most important conclusions) of the Ranger, Orbiter, and Surveyor programs. `ANSWER <Sect19_answers.html#19-14>`__
Mapping the Moon’s Surface Units; Lunar Stratigraphy
Early in the space program, when a lunar landing was the prime goal, scientists urgently needed information on the detailed morphology and other conditions on the surface. They planned and executed a series of missions that led to high quality geological maps of the entire front side of the Moon. Geologists at the U.S. Geological Survey in Flagstaff, AZ and elsewhere had already begun this mapping in the days before Lunar Orbiter, by direct telescopic observations; a noble effort that involved peering for hours through an eyepiece in a cold observatory, accompanied by sketching each item seen in the advancing fields of view.
These maps were the first with any detail for any of the other members of the solar system. The principles used to construct them were derivatives of the procedures applied to aerial photos (except that, at the time, field checks [actual ground truthing] were not an option to validate map accuracy). They first defined units on the basis of albedos or relative reflectances, essentially by their tonal variations, as observed visually or in photos taken through the telescope. Two fundamental concepts in stratigraphy were the chief guides: 1) the law of crosscutting (features or structures cut into the terrain were younger than the materials making up that terrain); and 2) the law of superposition (deposition or extrusion emplace materials on top of the terrain later than those beneath, with each overlying layer being progressively younger than the layer(s) immediately below). The most common exceptions; where structural deformation places older units on top of younger ones at thrust faults or where a fold lies on its side¾ do not seem to occur on the Moon, which lacks the conditions for compression needed to produce these effects.
However, scientists developed a new concept, using crater frequency and morphology, specifically for the Moon as a major tool in determining relative ages. Sparsity of craters on Earth preclude its use on our planet but crater “dating” works well on the planetary bodies imaged by missions beyond the Moon. The notion underlying crater frequency (or density, i.e., numbers of craters of all discernible sizes within some arbitrary counting area [typically 106 km2]) is straightforward. The simple idea is this: as time goes on, impacts will create more craters within the area, until they occupy all the space, i.e., the surface is saturated. Thus, older surfaces have more craters, and thus a higher frequency of craters of all sizes. The number of larger craters diminishes with size, and there are ever greater numbers of progressively smaller craters. This relationship is evident in this plot of crater frequencies for eight areas of the Moon, whose relative ages are expressed by the position of each plot.
|Plot of the number of craters per unit area (frequency) versus diameter for 8 areas on the Moon; the uplands have the largest number of craters.|
The pure uplands surface (curve U) is proposed as the oldest, whereas those associated with the interiors of Aristarchus (A) and Tycho (T) are the youngest. This means that for any given crater size (say, 250 m [812 ft] diameter), there are more craters per unit area (extrapolating to the ordinate or left vertical axis) in the uplands (about 10-1) than in the maria (M) and, in turn, more mare craters than inside Tycho T (about 10-3). Most of the plots are nearly parallel to one another, indicating the same relative proportions of craters at all size ranges. Scientists confirmed these relative surface ages, generalized here as decreasing to the left of the plot, by radiometric age dating of Apollo lunar samples collected from terrains whose ages had been estimated earlier by this crater-frequency counting method.
` <>`__19-15: Why does the highlands or uplands (U) plot stop abruptly at a crater diameter of about 500 meters? `ANSWER <Sect19_answers.html#19-15>`__
The next plot is a refinement of this technique that relies on modifications of crater shapes and degrees of degradation. The relative age decreases upward on the ordinate; i.e., the youngest craters are at the top. A fresh crater should be characterized by a sharply defined rim, well-preserved interior
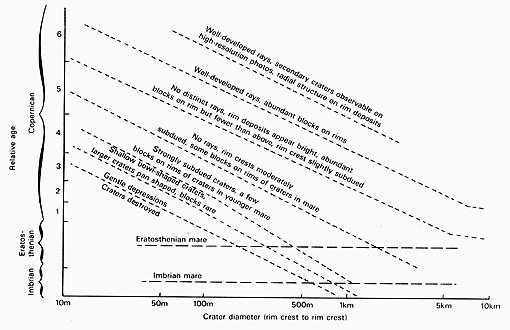
terraces, a distinct external ejecta blanket, and, if large, persistence of secondary rays. The degree of degradation depends on the length of time since its formation and on its size. Consider the category strongly subdued. If such a crater were 50 m (164 ft) in diameter, it would belong to the Copernican class (see the stratigraphic classification below), falling at about 3.8 (in relative age units; not in billions of years) on the age axis. If it were 500 m (1640 ft) wide, it would belong in the Erastothenian age group.
` <>`__19-16: Looking at the inclined dashed lines, what is happening as you go from lower left to upper right? `ANSWER <Sect19_answers.html#19-16>`__
The classic example of lunar geologic mapping is the region around the great crater Copernicus. Look at this Earth-based telephoto image of Copernicus and its surroundings:
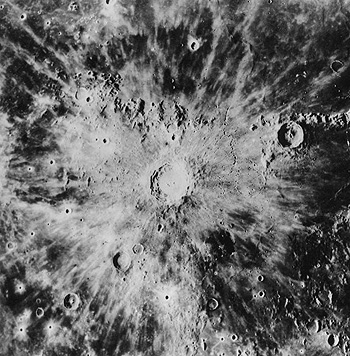
` <>`__19-17: How many distinct (different) mappable units can you pick out in this photograph? `ANSWER <Sect19_answers.html#19-17>`__
The most obvious feature is the crater with its slumped walls, central peak, and the ejecta blanket and rays that extend beyond. This crater is considered the “type locality” for impact structures on the Moon. Apollo 11 astronauts photographed the interior and rim of Copernicus as a major target of interest.

Now, examine the color-coded map made by astrogeologists from the U.S. Geological Survey, largely by long hours of observations through telescopes:
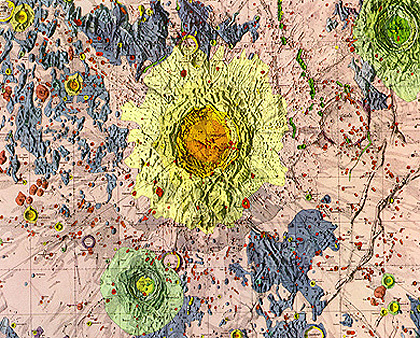
The oldest units are in blues and purples, being highlands-like terrain, consisting of ejecta blocks tossed over the lunar landscape from the impact of an asteroid that formed the Imbrium Basin to the north. The mare lavas (lavender-pink) filling the edge of Oceanus Procellarum largely “submerge” these units, known as the Fra Mauro formation. Small red-orange patches are lava domes. Craters cut these lava plains, including Erastothenes (the large one northeast of Copernicus, with its well-defined hummocky ejecta blanket), rendered in green, but one crater, Stadius, to the right of Copernicus, is older, being largely covered by lavas, so only a faint outline remains. Ejecta (yellow) surround Copernicus and a younger central fill (orange) is basaltic lava. Small red units are dark-halo craters of probable volcanic origin. Many of these relationships are difficult to see in the photograph but are visible to the geologists peering through their telescopes.
General mapping of the lunar surface in this way, re-enforced by radiometric age dating of returned Moon rocks, has led to a system of lunar units classification that follows the conventional stratigraphic approach used on Earth. Thus, scientists assigned period names to time intervals and relatively ranked all the events within these spans. For distinct units, they gave formation names. The stratigraphic column depicted in Earthlike Planets (by Murray, Malin, and Greeley, 1981) summarizes these classes. In our version, we replace period names by their equivalents in System (time and stratigraphic) terms. The Copernican System/Period began about 1.1 billion years ago, based on radiometric dating of ejecta from Copernicus.
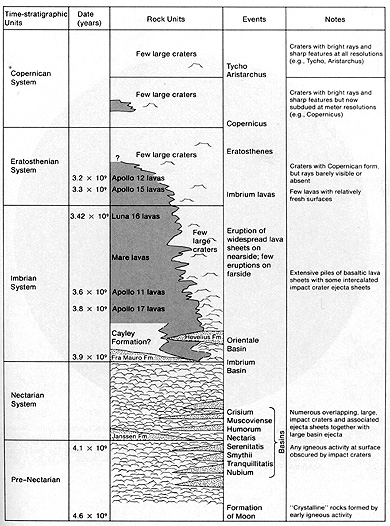
` <>`__19-18: Why are there specific dates associated with some intervals in this stratigraphic column and not with others for which particular events are defined? `ANSWER <Sect19_answers.html#19-18>`__
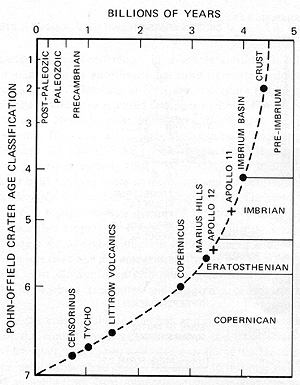
Pohn and Offield have constructed a general curve relating their interpretations of the degree of crater modification (freshness versus degradation) to the stratigraphic time units established in the above diagram. They have used radiometric dates to calibrate the position of the curve to the time intervals involved.
The history of the Moon falls into four major phases or stages: 1) formation, general melting, and development by differentiation of a lighter crust; 2) intense bombardment of that crust, producing most of the larger basins and many craters still surviving in the Highlands; 3) widespread extrusion of basaltic lavas (about 3.8 to 4.0 billion years ago), filling basins, some larger craters, and low areas embayed against or within the Highlands; and 4) reduced but still common additional impacts (such as Copernicus) on both solidified maria and highlands, continuing to the present-day (Tycho is likely less than a billion years old). Stages 2 and 3 have been visualized by an artist in the following diagram:
episodes of cratering: Left = pre-mare lunar surface; Right = Moon after maria emplaced but before later periods of cratering.|
Of special interest is the multi-ringed (successive rims) of the Imbrium basin (upper left), similar to the Orientale basin (not shown); these rings may be partially submerged by later mare lavas.
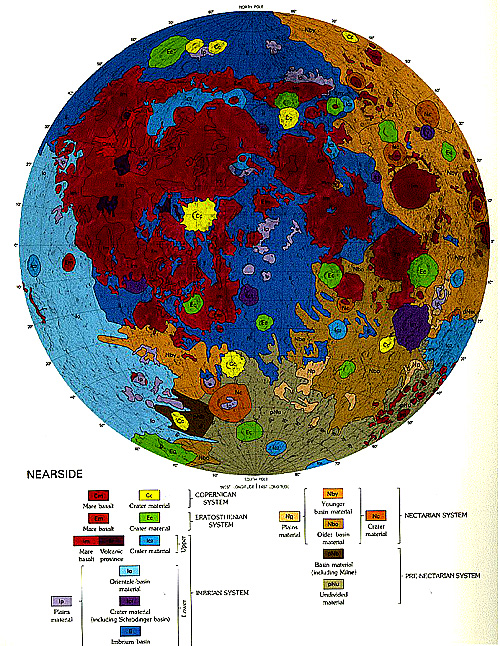
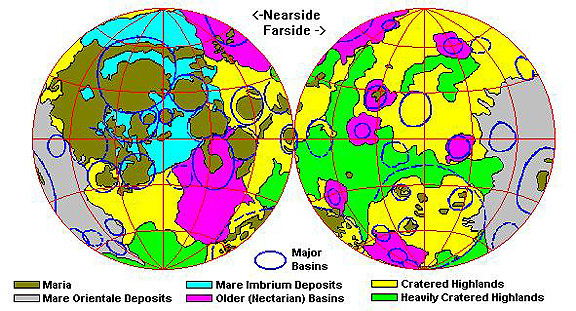
The geology of both near and far sides of the Moon can be generalized in terms of the types of units (cratered; ejecta-covered; mare lava-filled) at the surface. This map shows the results:
We close this page with the published U.S. Geologic Survey map of the front or near side of the Moon. The legend with named units and time periods is below it. To get your bearings, the yellow patch near upper left center is Copernicus; the yellow patch near the bottom is Tycho.