Pre-Apollo Exploration of the Moon
Because of its proximity (~240,000 miles from Earth), the Moon has always been the “heavenly body” most easily and ambitiously studied. The space program made the lunar surface an early target, with a number of exploratory and photographic missions and culminating with six manned landings during the Apollo Program. On this page some of the characteristics of the Moon, its albedo, the phases of illumination, and its orbital “locking” on Earth are described. Then, some of the remote sensing studies, optical and radar, of the lunar surface are considered.
Pre-Apollo Exploration of the Moon
Lets begin with an image that places the Moon in context with its parent planet Earth. This view, taken from the Galileo spacecraft to be described later, is what an extraterrestrial space traveler might see as he/she/it approaches the Earth-Moon system.
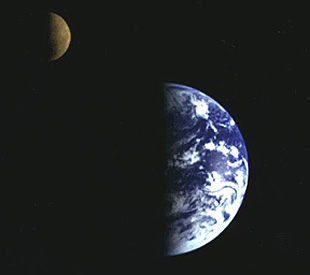
Without question, the greatest part of early remote sensing investigations of the planets, as expected from its proximity, centered on the Moon. Indeed, its mean distance from Earth of 384,400 km (238,860 miles) meant that even before the 20th Century, dreamers could fancy someday going there for a visit (Best known fantasy: Jules Verne’s Journey to the Moon). Earth’s sole satellite is much smaller than the parent body: 3475 km (2172 miles) in diameter. (For a quick synopsis of the Moon’s general characteristics, read through this review by Bill Arnett: The Moon). Then, also check with the Web Site Rosanna Hamilton’s Moon Page, looking particularly at the Table of Lunar Statistics and the section on the origin of the Moon stemming from an early huge impact of an asteroid with the primitive Earth).
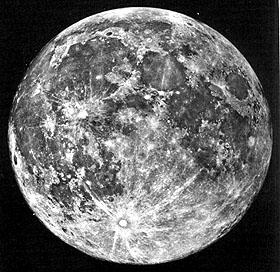
The first telephoto image of its surface was made in the 1860s. Prior to the space program, almost all studies used the telescope. At first, emphasis was on optical observations (and photographs) within the visible spectrum. Among the first measurements was the Moon’s albedo, the ratio (stated as a percentage) of the light reflected to the light incident on a surface. (The Earth’s albedo is 39% on average [with slight fluctuations due to varying cloud cover] and Venus falls between 70% and 90% [from strong reflections of sunlight by a thick planetwide cloud cover].) By comparing albedos measured on possible terrestrial counterparts, the lunar albedo offers insights into the composition, texture, and structure of its surface materials. At full Moon, dark areas known as maria have albedos of 5% to 8%, while brighter areas, generally coincident with elevated terrain called highlands or (in Latin) terrae, range between 9% and 12%. These albedo differences are evident in this full Moon photograph, taken from the Lick Observatory in California (M. stands for Mare in the labels; A refers to Apollo Landing Sites [in red]; and major craters show in yellow):
(Note: Tycho is mislabeled in this image; it is a large crater in the highlands well to the left of its label, located about 1/5th of the way in from perimeter at “7:00 o’clock”.)
The above rendition is striking in its sharpness, but in achieving the tonal balance that highlights the craters, the ray deposits from Tycho, Copernicus, and others are strongly suppressed. Tycho (85 km rim-to-rim diameter) whose very long ejecta rays are visible to the naked eye from Earth, is very conspicuous in this next fullmoon image in which the lighting and processing are optimized to display these ejecta deposits. Again, Tycho is near the bottom, with a dark rim, and at the locus of the converging light rays; this implies that it formed recently enough (in the last billion years) so that the ray material has not been obliterated.
` <>`__19-2: How many of the Apollo landings were in the maria; in the highlands? `ANSWER <Sect19_answers.html#19-2>`__
Once established, the trick is to interpret these albedo values. We can measure the albedos of likely surface materials in the laboratory, where we can vary the textures and illumination conditions. In this way, lunar scientists postulated that the maria were some type of volcanic material, most likely basalt. The highlands were more enigmatic. Several other volcanic types could produce albedos in the proper range, but uncertainties about particle size and other variables inhibited definitive identification. The first unmanned landers, the five Surveyors, resolved the problem. The answer was that the highlands included a different group of rock types, of which anorthosite was prevalent, containing larger amounts of light-colored feldspars. Investigators judged that the albedo values for the maria and highlands were consistent with scattering by granular or fragmental textures associated with unconsolidated surface materials (some thought the craft would sink into loose, almost powdery rock debris, which, fortunately, didn’t happen).
` <>`__19-3: What would have happened to the Apollo program if the lunar surface indeed had a thick cover of powdery dust? `ANSWER <Sect19_answers.html#19-3>`__
The total intensity or brightness of reflecting surfaces at specific points or areas varies with the phases of the Moon (progressive waxing and waning due to illumination changes, depending on relative positions of the Sun, Earth, and Moon). The lunar photometric function, a plot of intensity versus phase angle, represents the intensity mathematically. The degree of polarization of light from the Moon also shifts with the phase angle and can show considerable variations in different regions of the Moon, again related to composition and textural changes.
` <>`__19-4: What are the vernacular names applied to the phases of the Moon? `ANSWER <Sect19_answers.html#19-4>`__
By selecting certain major features on the Moon’s front face as reference points, one notes that the same face of the lunar sphere is seen during the entire period of its revolution around the Earth. This curiosity is the result of the Moon’s sidereal revolution period of 27.3 days being equal to its axial rotation period. In effect, a center point on the lunar frontside is seemingly locked on the Earth, i.e., an imaginary line perpendicular to the lunar surface at that point would extend towards the Earth’s center at all times during the Moon’s orbital transit. This remarkable condition describes a state of captured or synchronous rotation. The synodic lunar month is 29.5 days. This increase in time by approximately 2.2 days results from the combined relative motions of both Earth and Moon forward in orbit around the Sun during which the illumination angle with respect to the Sun will be shifted; the Moon thus requires extra time for the first sliver of reflected light at New Moon to be seen from a reference point on Earth to compensate for the angular advance of the Earth-Moon system since the previous lunar month began.
` <>`__19-5: What is the difference between rotation and revolution of a planetary body? `ANSWER <Sect19_answers.html#19-5>`__
Although the Moon is nearly a sphere, one side always facing Earth, inspection of photographs taken on different dates discloses an apparent shift of major landmarks relative to reference point at the lunar limbs. Mapping demonstrates that almost 60% of the total surface (front and back) of the lunar sphere has been seen from Earth through telescopes. Because this seems to be a “wobbling” or “rocking back and forth”, the term libration (from a Latin word for “balance”) is applied to the phenomenon. Librations result in part from apparent (optical) displacements that bring more of both equatorial and polar regions into view. The motions involve variations in angular velocity of the Moon’s revolution in elliptical orbit, tilt of its rotational axis relative to its orbital plane (inclined at 5°09’ to the ecliptic), and parallax effects for different observation points on Earth. There is also a real libration owing to varying gravitational pull by Earth as the Earth-Moon distance varies and by the Moon’s departure from perfect sphericity (it has an equatorial bulge of +2 km resulting from gravitational attraction to Earth).
` <>`__19-6: Most people live in the Northern Hemisphere of Earth. It is a little known fact to many such individuals that the Moon is “upside-down” in the Southern Hemisphere, with Tycho near the top and Mare Imbrium towards the bottom. Can you explain why? `ANSWER <Sect19_answers.html#19-6>`__
Even before the pre-Apollo and Apollo programs, scientists examined the Moon in the multispectral mode (we show a recent example on page 19-6b). The simplest approach was to use photofilters that pass limited spectral ranges. Thus, they examined the Moon in the UV, blue, green, red, IR, and other spectral intervals. This technique brought out variations in color shades that appeared to distinguish different surface units. Some maria tended to have stronger blue components, while others were more reddish. Differences between maria and highlands were accentuated. These subtle variations related to the influence of elements, such as calcium, iron, and titanium, on the behavior of reflected light at different wavelengths. Some investigators made more exacting measurements by passing the light through a spectrometer, which provided semiquantitative estimates of variations in percentages of several of the common elements. Higher values for iron, magnesium, and calcium supported the surmise that lunar rocks were most probably of basic igneous composition (silica-low, but Fe/Mg-rich).
The astronauts orbiting the Moon described its color as dominantly medium to dark grays with tan overtones. We have obtained many pictures of the lunar surface, starting with unmanned pre-Apollo missions, then through numerous Apollo shots, and, afterwards, in a series of images sent back by the Galileo spacecraft as it passed Earth enroute for its rendezvous with Jupiter, and then by the Clementine orbiter (page 19-6b). A typical image of the near full Moon, taken from the Apollo Command Module, shows much of the farside (some have called this the “backside” but its connotation rules this out) and part of the eastern limb visible from Earth. Visible maria include Smythii, Marginis, and Crisium (near circular), .
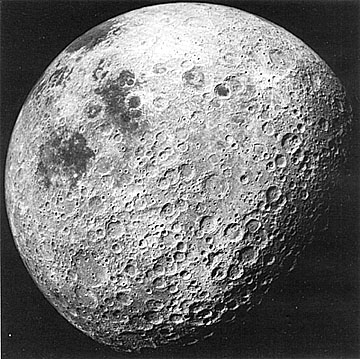
` <>`__19-7: Considering the upper diagonal half of the above full Moon image to be typical of the farside, how does it differ from the full Moon view seen from Earth? `ANSWER <Sect19_answers.html#19-7>`__
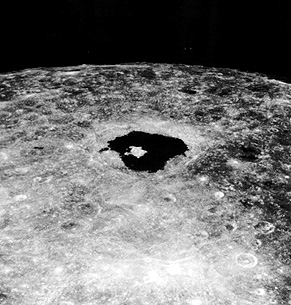
The best known crater on the far side, imaged by the Russian Lunik and Zond spacecraft, and shown here in a higher resolution photo taken by an Apollo 9 astronaut, is Tsiolkovsky (a Russian lunar astronomer) with its filling by dark lavas.
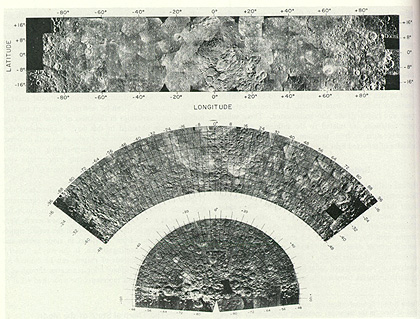
As early as 1946, radar had provided more images of the full Moon and selected regions. Sent from Earth transmitters, signals returned as polarized backscatter, in which we measure time delays and Doppler frequency shifts. Here are three mosaics in Mercator (top), Lambert Conformal, and Polar Stereographic projections made from reflections of 3.8 cm pulses sent by the Haystack Observatory at the Massachusetts Institute of Technology:
Infrared scanners, operating through telescopes, can acquire thermal emission images of the Moon’s surface. The ideal time to sense the full Moon is during a total lunar eclipse:
|View of the Moon during a total lunar eclipse, produced by scanning its surface in the thermal IR (10 - 12 mm); the white dots are |
Under this condition, bright areas called “hotspots” appear, many of which, correlate with large lunar craters. These craters often contain dark lavas that absorb solar radiation (for more on this black body effect, see page 9-1) and re-emit it at higher radiant temperatures. During such times, observers also look for “lunar transients” (localized short-lived bright, often reddish glows visible to the eye) that some believe are evidence of volcanic activity and other thermal phenomena. Some people claim to see these volcanic events, even when the Moon is normally illuminated, particularly in the shadowed areas (dark phases).
` <>`__19-8: Think of another possible explanation for these glowing transient phenomena. `ANSWER <Sect19_answers.html#19-8>`__
The above eclipse photo was taken more than 50 years ago from a ground telescope. In September 1999, a NASA spacecraft called MSX was in position to image a total lunar eclipse using an IR channel. Here is the result; compare the hotspots here to those in the telescope image above.
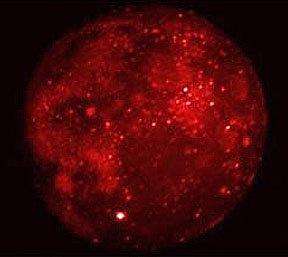
The large bright spot is Tycho, which appears to be the hottest spot on the Moon’s frontside.
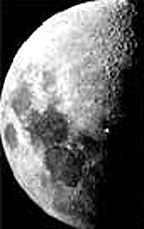
Moon watchers, especially those in the amateur ranks, have been conditioned to look for transients whenever they are observing. (Much credit for this is due to Mrs. Wini Cameron, a friend of the writer’s, who spent much of her professional life [at NASA Goddard] in promoting the validity of transients). Among this category of observations is the a controversial sighting, made by an amateur, Dr. Leon Stuart, that he also photographed through his home telescope. A strong visual flash appeared to him on November 15, 1953 for just a minute or so near the lunar terminator; his photo shows this as a bright dot.
At the time he interpreted this spot to be a glow from energy released when a meteorite struck the Moon’s surface. Although believable, there were doubters, and the idea remained in dispute until 2002. Interpreters of the imagery telemetered back by the spacecraft Clementine (see page 20-6b) found an image that contained the estimated point of possible impact. Here it is:
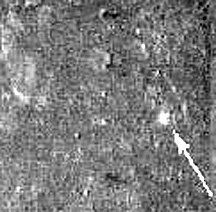
This has all the “earmarks” of a fresh crater. From its size (1.5 km diameter), an incoming bolide 20 m in diameter upon collision released about 500 kilotons of energy as it dug out this now confirmed impact structure that is probably the most common sign of continuing activity on the Moon. But, still “luck” played a key role in this discovery.