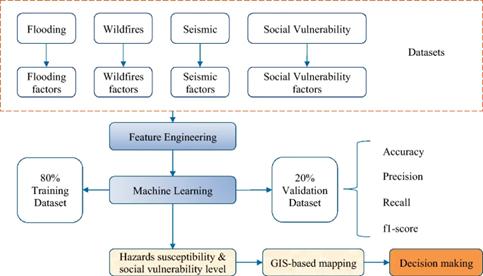
The regional multi-hazards risk assessment poses difficulties due to data access challenges, and the potential interactions between multi-hazards and social vulnerability. For better natural hazards risk perception and preparedness, it is important to study the nature-hazards risk distribution in different areas, specifically a major priority in the areas of high hazards level and social vulnerability. We propose a multi-hazards risk assessment method which considers social vulnerability into the analyzing and utilize machine learning-enabled models to solve this issue. The proposed methodology integrates three aspects as follows: (1) characterization and mapping of multi-hazards (Flooding, Wildfires, and Seismic) using five machine learning methods including Naïve Bayes (NB), K-Nearest Neighbors (KNN), Logistic Regression (LR), Random Forest (RF), and K-Means (KM); (2) evaluation of social vulnerability with a composite index tailored for the case-study area and using machine learning models for classification; (3) risk-based quantification of spatial interaction mechanisms between multi-hazards and social vulnerability. The results indicate that RF model performs best in both hazard-related and social vulnerability datasets. The most cities at multi-hazards risk account for 34.12% of total studied cities (covering 20.80% land). Additionally, high multi-hazards level and socially vulnerable cities account for 15.88% (covering 4.92% land). This study generates a multi-hazards risk map which show a wide variety of spatial patterns and a corresponding understanding of where regional high hazards potential and vulnerable areas are. It emphasizes an urgent need to implement information-based prioritization when natural hazards coming, and effective policy measures for reducing natural-hazards risks in future.
In recent years, natural hazards have become severe threats to society and continued to have a heavy toll on human being. Approximately 45,000 people globally (representing around 0.1% of global deaths) died yearly from natural disasters over the past decade. The United States (US) had sustained 341 weather and climate disasters since 1980, where the total cost of these events exceeded $2.475 trillion, and overall damages/costs reached or exceeded $1 billion (reported by National Centers for Environmental Information, www.ncei.noaa.gov/access/billions). In addition, the previous study showed that over half (57%) of the US structures (office buildings, community houses, schools, hospitals, etc.) were built in hazard hotspots, and about 1.5 million structures were located in hotspots of two or more natural hazards. There was growing awareness of the fact that different hazards could happen simultaneously or successively which would amplify their overall impact on communities. Multi-hazards were defined based on this phenomenon, which could result in a higher number of fatalities, injuries, and displacement of people compared to a single hazard. It could also exacerbate pre-existing vulnerabilities and inequalities, such as poverty, lack of access to resources, or inadequate infrastructure. Moreover, multi-hazards could create complex and interdependent challenges for emergency management officials and policymakers, who must balance competing priorities and coordinate responses across multiple agencies, jurisdictions, and sectors. These challenges highlighted the need for effective multi-hazards risk assessment to help communities better prepare for and respond to natural hazards.
This work has explained spatial relationships between multi-hazards and social vulnerability in Idaho, US, where flooding, wildfires, and seismic are the most significant natural hazards. Two public open access datasets are used to characterize the distribution situation of flooding, wildfires, seismic and social vulnerability in this study area. The composite SoVI is used to quantify social vulnerability. Machine learning-based models are implemented to predict the natural hazards potential and social vulnerability level, respectively. The combination of multi-hazards level and SoVI deliver quality evidence that increases public awareness, support information-based policymaking in disaster risk management, and prioritize mitigation and resiliency actions that reduce risk to life and property in high-risk areas.
Results show that the RF overperforms other machine learning-based models on precision, recall and F1 score, which offers a good promise in both the natural hazards and social vulnerability level classification. The multi-hazards map at the county subdivision level, reveals that most land is not prone to high-level multi-hazards. Cities with high hazards level and cities with high social vulnerability account for about 39% and 33% of total studied cities, respectively. Cities with high multi-hazards risk account for 15.29% of total studied cities. The multi-hazards risk index map can be used for integrated and comprehensive watershed management and land use planning and, consequently, for sustainable development in the study region. In addition to the insights of multi-hazards risk, recognizing the vulnerable or susceptible areas and identifying the main drivers of high social vulnerability level can provide the government and decision-makers more robust information, and assist them in disaster risk reduction.
Although this paper studies the spatial relationship and interactions of multi-hazards and social vulnerability in case study area, similar framework can be performed in other geographical areas to consummate multi-hazards risk assessment from a comprehensive perspective. As this framework can be easily replicated using only public open data, we hope this research will inspire the development of similar models and decision-making tools to identify the highest hazard risk but high social vulnerability areas. Moreover, while the data need to be updated, machine learning-based models can help to update and improve the speed of analysis. For instance, the census information using for estimations of social vulnerability is often updated every five years, machine learning models can help to capture this online updated census information and adjust social vulnerability to natural hazards and even to produce future projections. Also, the information improvement in government reports (e.g., newest edition) can be adjusted and handled quickly via a set of machine learning pipelines. We believe such tools are needed and valuable, it can provide decision-makers with more precise and timely information about potential hazards, which can help them make more informed decisions and take appropriate actions to mitigate the risks.
Sources:
Scientific Reports
https://www.nature.com/articles/s41598-023-40159-9#Sec1 .
Provided by the IKCEST Disaster Risk Reduction Knowledge Service System
Comment list ( 0 )

