Researchers from the University of Bonn are re-analyzing satellite data to calculate global water distribution. While some parts of the world suffer extreme heat and persistent drought, others are being flooded. Overall, continental water volumes vary so much over time that global sea levels fluctuate significantly too. By combining the hydrological model WaterGAP with GRACE satellite data, a team of geodesists at the University of Bonn have come up with a new set of data that shows how the total distribution of water over the Earth’s land surfaces has changed over the past 20 years more accurately than ever before. Their findings are now being published in the “Journal of Geodesy.”
“The new method allows us to test out model calculations on the future effects of climate change, particularly how rising temperatures and changes in precipitation patterns will impact the water balance in different parts of the world,” says Prof. Dr.-Ing. Jürgen Kusche from the Institute of Geodesy and Geoinformation at the University of Bonn. The process involves comparing climate models, which invariably cover a certain period of time in the past, with the results of actual measurements, and Kusche and his team are planning several such studies over the coming months.
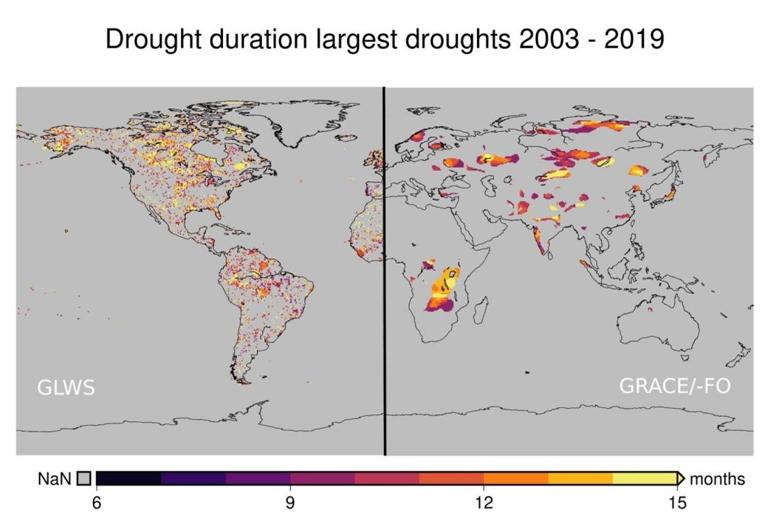
The improved resolution that the team has achieved shows that droughts are significantly more common across the world than the GRACE satellite data would suggest in isolation. “What we’re seeing is that even extensive droughts like the massive one that struck the whole of the Amazon in 2010 are spread across much wider areas than the satellite data indicates on its own,” Kusche says. “This means that the satellites aren’t picking up many of the more localized droughts.”
Masses of water causing changes in the gravitational field
Between 2002 and 2017, the GRACE (Gravity Recovery and Climate Experiment) twin satellites measured changes in the Earth’s gravitational force. Its successor project, “GRACE-FO,” launched in 2018, and it was this data that the researchers from the University of Bonn used. Since the Earth’s gravitational force is dependent on changes in mass, this allows conclusions to be drawn about the water cycle close to its surface. Gravity is affected by changes in groundwater and surface reservoirs and by melting glaciers.
“One unique advantage of the GRACE measurements is that they cover all kinds of reservoir, i.e. including changes in groundwater reserves that are hidden deep below the Earth’s surface and in tens of thousands of artificial lakes and wetlands,” says Kusche’s colleague Helena Gerdener. The disadvantage, she says, is that the spatial resolution of the data on the gravitational field is relatively inexact at about 300 to 350 kilometers as a result of the measurement principle applied. This means that reliable statements can only be made for areas around 100,000 square kilometers in size. To give some idea of scale, this minimum area is still larger than Bavaria, Germany’s largest federal state at “only” 70,000 or so square kilometers.
For the first time, the researchers have now combined measurements from the GRACE and GRACE-FO satellites with the WaterGAP hydrological model, which itself integrates high-resolution meteorological data. This has enabled the resolution of the water distribution maps thus generated to be improved to 50 kilometers. To do so, the researchers used a mathematical technique known as data assimilation, which is more usually to be found in weather forecasting. However, the scientists did not simply take the results of the hydrological model and the satellite data and calculate the average values. As Kusche explains: “The calculations from the hydrological model are adjusted so that you get close to the satellite data while modifying the physics that the hydrological model draws on as little as possible.”
1,000 measuring stations for testing purposes
The researchers used around 1,000 measuring stations to test the quality of the continental water distribution maps that had been produced by combining the satellite data with the hydrological model. “Of course, you’ll always see some regional differences,” Helena Gerdener admits. Across the board, however, she says that the combined data fits the measurements better than the calculations that had been based purely on either the GRACE satellite data or the hydrological model.
Source:
Universität Bonn
Provided by the IKCEST Disaster Risk Reduction Knowledge Service System
Comment list ( 0 )

