HYPERSPECTRAL REMOTE SENSING
Laboratory and field spectrometers have proved the value of obtaining a “continuous” spectral curve covering extended segments of the EM spectrum. But for most of the early remote sensing era, technology prevented using spectrometers on moving platforms - aircraft, and certainly not spacecraft. All that changed by the mid-80s when Charge-Coupled Devices and very fast signal readout systems developed to a level where spectrometric instruments flying above the Earth could contain enough channels, each of narrow bandwidth, that could be rapidly sampled and reset so as to function as a working spectrometer. This has opened up a truly powerful new approach to remote sensing, called hyperspectral spectrometery, which already has proven to be a superior identifier of materials found at the Earth�s surface - rock types, minerals, plant species, etc. can often be identified specifically. The first truly successful model, AVIRIS, flew on aircraft. Its end products were both spectral signature plots, that closely resembled those produced on the ground, and a large number of images made from any of the plus 200 individual channels (detectors) comprising the system. Each such product was valid for the small “piece of real estate” (the pixel) examined at any moment; the resulting array leads to images of a much larger area.
Imaging Spectrometers
Almost all sensors that are multispectral in function have had to sample the EM spectrum over a relatively wide range of wavelengths in each discrete band. These sensors therefore have low spectral resolution. Spectral resolution can be defined by the limits of the continuous wavelengths (or frequencies) that can be detected in the spectrum. In remote sensors an interval of bandwidth of 0.2 µm in the Visible-Near IR would be considered low spectral resolution and 0.01 µm as high resolution. (The term has a somewhat different meaning in optical emission spectroscopy, where it refers to the minimum spacing in µm or Angstroms between lines on a photographic plate or separable tracings on a strip chart.) Since higher spectral resolution leads to much more definitive information on the composition and certain physical properties of different materials and objects, being able to build and operate sensors with such resolutions has been a goal since remote sensing was in its infancy. The term applied to high spectral resolution systems is hyperspectral remote sensing.
Beginning in the 1980s, Dr. Alexander F.H. Goetz and his colleagues at the Jet Propulsion Laboratory began a revolution in remote sensing by developing a powerful new instrument called AVIRIS (for Airborne Visible-Infra Red Imaging Spectrometer).:sup:*` <Sect13_050.html#1>`__ This instrument took advantage of new detector technology to extend ground-based spectrometers into the air on moving platforms. Thus, the distinct value of obtaining hyperspectral curves has made it possible to acquire detailed data on the materials and classes present on the Earth’s (or other planets) surfaces. Essentially these curves are continuous spectral plots that measure reflectances from the ground, water, or the atmosphere in the wavelength region responding to solar illumination (Visible-NearIR-Shortwave IR). The plots also record the fine details of absorption phenomena.
` <>`__13-16: So, once again, in your own words: What is/are the main advantage(s) of hyperspectral remote sensing? `ANSWER <Sect13_answers.html#13-16>`__
As they gained experience operating AVIRIS, they built other imaging spectrometers, using different spectral dispersion devices, detector sizes, and other variables. We shall discuss the basics of instrument design later, along with a list of many of these operational spectrometers. As a result a large number of service organizations have emerged or expanded to offer hyperspectral remote sensing from aircraft as a commercial product. By the turn of the millenium, imaging spectrometers will enter space. At one point, the Space Shuttle manifest included a spaceborne version of AVIRIS, known as SISEX, but it fell victim to technological and budgetary constraints. A HyperSpectral Imager (HSI) was launched in 1997 onboard the Lewis satellite, but that system failed to reach a functional orbit.
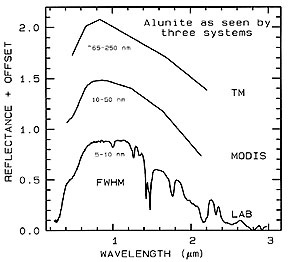
The obvious improvements in information content gained by operating a spectrometer from air/space platforms are evident in this plot of the spectral response for the mineral Alunite (potassium-aluminum sulphate).
Before describing these various imaging spectrometers and examining imagery and applications associated with them, we need to take a more extensive look into the fundamentals of spectroscopy than we presented in the Introduction of this Tutorial. To do this, we provide, in the next few pages, a condensation of a valuable review produced by a leading spectrometrist, Dr. Roger N. Clark of the U.S. Geological Survey.
Primary Author: Nicholas M. Short, Sr. email: nmshort@nationi.net