The Shuttle Radar Topography Mission
The most ambitious effort to date to map much of the Earth’s land elevations from space using radar interferometry was embodied in the Shuttle Radar Topography Mission (SRTM), flown as the main scientific experiment on STS-99 in February of 2000. Two NASA-JPL radar units, an L-band and a C-band, were mounted on a boom that extended 60 meters into space from the Shuttle cargo bay. The signals received are combined and analyzed using the interferometric method. The SRTM data have a 30 by 30 meter ground resolution and a vertical resolution that varies from 16 to 10 meters, depending on conditions. On the same mission, an X-band radar unit provided by the German DLR also gathered data that could be integrated with either or both JPL radars to add to the inputs needed to generate topographic profiles and maps. During the 10 day Shuttle mission, almost 80% of the land surface was covered, providing a near global topographic data base superior to any devised previously.
The Shuttle Radar Topography Mission
The response from the U.S. community, through NASA and joined by a German organization, is the Shuttle Radar Topography Mission, which was successfully launched (Mission STS-99, Shuttle Endeavor) on February 11, 2000 and operated for 10 days, gathering data that covers approximately 80% of the land surface. It will take about 2 years to fully reduce all data and provide topographic maps in various formats. C-band and X-band radars (see page 8-1 for wavelengths) operate from one pair of transmission-receiving antennas in the Shuttle payload bay and a matching second pair (receiving only) at the end of a collapsible boom of 60 m length (actual distance between inboard and outboard antennas is 83 m), so that dual signal return simulates the separation needed to provide parallax-like data. Here is a view of the boom (right) center as it was extended during the mission.

NASA JPL supplied the C-band instrument pair. The data from 159 orbits (at angles to the equator that allow monitoring the Earth between 65° N and 50° S), at a Shuttle altitude nominally at 233 km (145 miles), extend for each pass over a swath width of 225 km (141 miles), so that continuous operation for 10 days provided nearly total coverage (with some duplication) of the land traversed. Under these conditions, the radar image has a ground resolution of 30 x 30 m and a vertical (elevation) resolution of 16 m (absolute) and 10 m (relative).
Processing the data into a stereo-mode which, through the principle of interferometry, can be converted into elevation differences and then restructured as a DEM data set by incorporating bench marks (known elevation points), is summarized in this diagram (somewhat degraded by low Internet resolution):
In essence, radar holograms from both antennas are generated (and can be converted to images). Then, while still in digital mode, these utilize phase information to construct interferograms (again, displayable as images). After introducing known elevation points to the data set, a digital height model (DEM type) can then be used to contruct a relief or shaded relief image. That can be combined with other data types (e.g., Landsat imagery) or converted to other map forms.
Let us look at a typical C-band image, of an area covering part of Dallas, Texas:
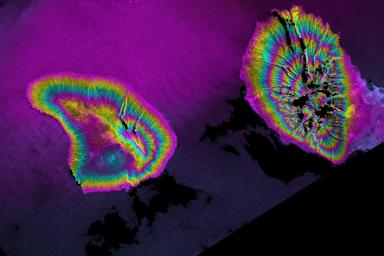
Next, examine this interferogram that shows the distinctive color banding such a data type presents. The two islands are West Maui and Lanai in the Hawaiian chain. Each cycle of colors (from pink to blue to pink) passes through an equal amount of elevation difference (400 m [1300]) in a manner similar to broad contour lines.
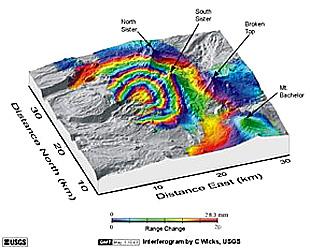
One of the practical uses of SRTM data resides in the monitoring of changes of elevation over time. This can be important as a tool for observing the swelling of a volcano with newly emplaced lavas. This causes the volcanic edifice to undergo upward swelling of the surface. This next illustration shows changes in the surface in and around the Three Sisters, volcanic stratocones in the Oregon Cascades near Bend, OR. To construct the change plot, data from several collection times over an extended period are used.
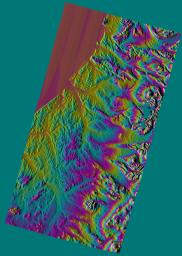
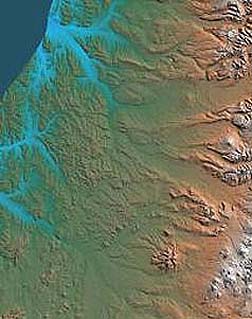
To illustrate some of the different image types derivable from SRTM data, we will display coverage of a pass across the Kamchatka Peninsula, a volcanic mountain chain in eastern Siberia. The first view is the interferogram whose color fringes suggest relief.
From that, a shaded relief (computer-generated artificial light imposes a pattern of shadow and light) and a shaded relief perspective view are derived:
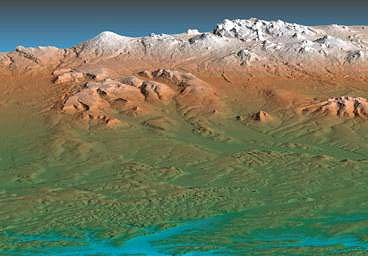
When SRTM data are combined with Landsat, these views of the Kamchatka mountains ensue:
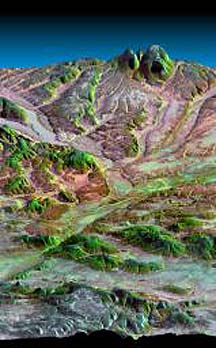
Kamchatka Peninsula over a wider area.|
Still another SRTM example from the same part of the World is Hokkaido Island in Japan, with its active volcano, USU.
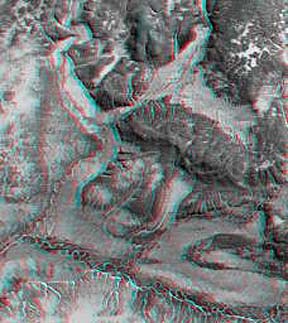
A special type of stereo image known as an analglyph is made by projecting one of the image pair through red and the other through blue filters to give the resulting superimposed image. To see relief in stereo, for this segment of the Kamchatka peninsula, a pair of glasses made usually of cardboard with the right eye opening covered by red cellophane and the left with blue are needed. A few users of this Tutorial may have one from a 3-D movie experience or can make the glasses in the obvious way.
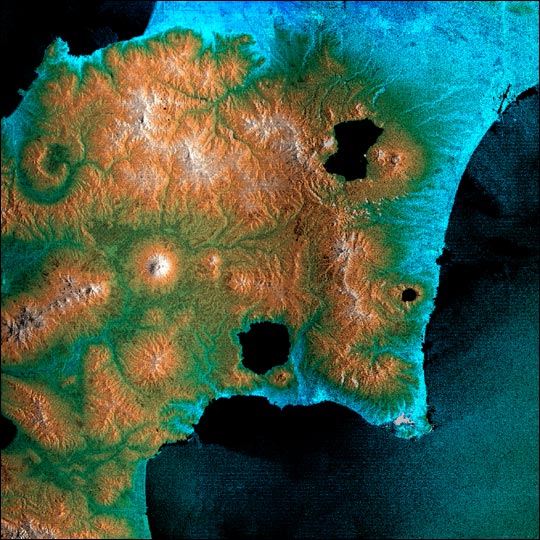
The X-band radar on SRTM is provided and managed by DLR - the Deutches Fernerkundungs-datenzentrum (the German Aerospace Center). Its antenna setup is similar to JPL’s C-band system, the difference being that the antenna in the Shuttle Bay is fixed to look straight down, rather than inclined. Thus its swath width is 50 km. Data processing to produce elevation maps is essentially the same. Here is an X-band image of part of the Kamchatka Peninsula; the highest point in the mountains is 4755 m (15690 ft):
For those interested in additional information and updates and more imagery, tie into the JPL and German Aerospace SRTM Web sites.
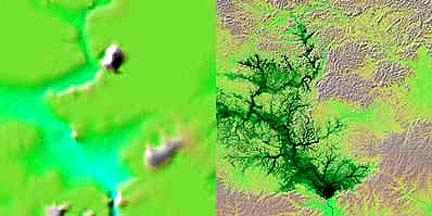
How much of an improvement in small-scale map quality in those parts of Earth where topographic maps are lacking in details found in, say, coverage of the United States? This next image is convincing: on the left is a colorized map of the Uatuma River Basin near Manaus in eastern Brazil based on the best elevation data available; on the right is a SRTM image processed to display the optimum topographic representation extractable from the radar data. The black areas in the map on the right depict the water buildup in Lake Balbina created by damming the river.
By mid-2003, the SRTM task force had completed a topographic map of the entire land surface between 60°N and 60°S over the world. This results from the efforts involved in the SRTM30 project. Although more accurate maps exist for some parts of this surface, this global map represents the best and most uniform quality map of the continental elevations now extant.
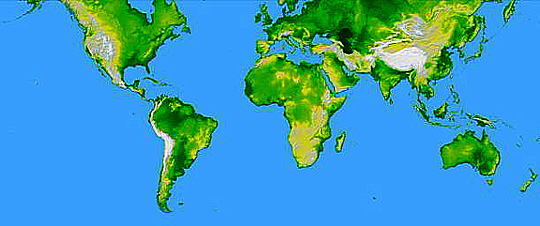
Dark green denotes the lowest regional elevations. Brown grading into white defines the highest elevations - in southern Asia and the West Coasts of North and South America.
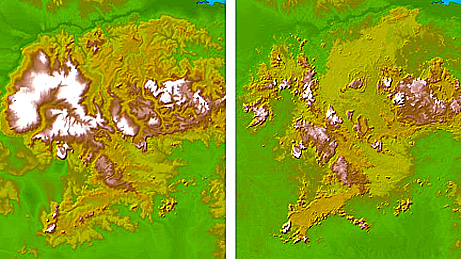
To gain an insight into the improvements resulting from SRTM30, consider these two maps of the Guiana Highlands in the Guyana Shield of northern South America. The map on the left below was compiled from the best published data prior to 2000; its surface resolution is 986 meters. On the right is the SRTM30 version, at 30 m ground resolution and 10 m vertical resolution. This latter is far more accurate; note how the higher elevations shown in the left map are greatly diminished (i.e., were initially exaggerated) as the truer configuration from SRTM replaces the older version.
Follow-up programs are “in the works” to use radar interferometry and laser profiling to continually upgrade topographic/elevation mapping of the entire world.