Geologic Folds from Space
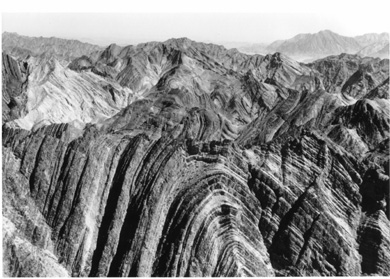
One of the geologic phenomena that shows up strikingly in space imagery is that of the structural deformation of crustal rocks which produces folds. These warped or arching of units tend to stand out because of differential erosion which leaves the more resistant layers as ridges rising above the more easily eroded units. Several examples of folds as seen from the ground are compared with two typical examples of space-observed folding from above.
Geologic Folds from Space
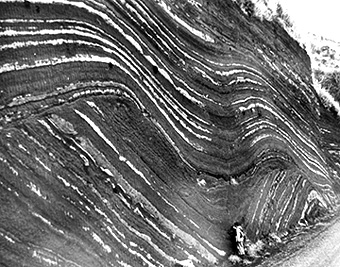
Space imagery is well-suited for us to recognize and interpret types of distortions of layered strata that produce such geologic structures as folds, faults, and fracture sets (joints). Some of these structures are so small that we must identify them on the ground. As an example of what lies below the resolutions achievable from space, consider this photo of a small outcrop exposing crumpled shale layers, that form miniature anticlines and synclines (this same pattern occurs on grander scales such as the major folds of the Appalachians).

On a somewhat larger ground scale, look next at the folding shown in this outcrop photo of volcanic ash layers in Japan. There is an erosional discontinuity (unconformity) that separates earlier folding in the lower half from folding (above) after later ash flows were deposited.
The folds shown above occur in supracrustal rocks, those above what is commonly called the “basement” rocks that make up the underlying (generally older) core of a continent (in the craton) and are composed of metamorphic rocks mixed with igneous rocks. At one time, before reaching the present surface, these deeply buried rocks were hot and “soft” (plastic-like). Under those conditions, layers in these crystalline rocks are deformed by squeezing and crumpling of heated units under high pressure as metamorphism proceeds. Here is an example of this type of folding (technically, called ptygmatic); note the hammer for scale. This folding is normally not detectable by space sensors (except those with very high spatial resolution).

However, larger features at regional scales often show obvious patterns of geometric curvature or displacement that stand out in relation (context) to neighboring features, as best displayed in space images covering extensive areas. We used the Waterpocket Fold in the preceding pages of this Section to introduce this idea.
That Fold is somewhat a special case since it has a single inclined limb. More common are folds with limb pairs inclined in opposing directions. We saw examples of this in the Section 1 Exam you may have just completed. There, the Folded Appalachians were highlighted. These tend to be elongated but do end, and are thus referred to as closed. A more obvious example are these next folds in the Sierra Madre Orientale (fold belt) near Monterrey, Mexico, as shown in this Landsat 7 TM image.
Next, we take a quick look at classic folds in Australia, Iran and northwest Africa. Elsewhere in this Tutorial (e.g., in Section 8 on Radar; Section 17, page 17-3), we describe other examples of folding depicted at regional scales.
For the moment we will preview the radar expression of folding with this look at a SIR-A image of closed structures composed of metasedimentary rocks in the Hamersley Range of northwest Australia.
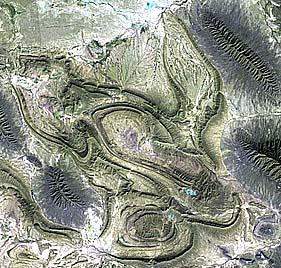
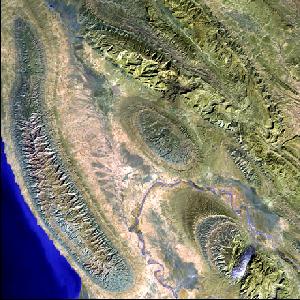
The full Landsat scene below covers part of the Zagros Mountains along the southwest coast of Iran by the Persian Gulf. These mountains consist mainly of elongate folds which arch upwards as anticlines and downwards as synclines. The anticlines here make up distinct landforms as high hills with central ridges that taper at either end (a condition referred to as a closed fold).
A simple analogy is to imagine cutting a watermelon in half through its longest dimension and laying the flat side on the floor. From above it resembles some of these Zagros anticlines. If we cut through it again across the long dimension at the mid-pointer, the exposed cross-section through green outer skin, white rind, and reddish center would appear similar to the folded strata within the anticlines.
These elliptical anticlinal folds in western Iran comprise a belt that is unsurpassed anywhere else in the world for their symmetry, extent and quality of exposure. Here is a more detailed look using a Landsat-7 ETM+ image:
` <>`__2-11: Why don’t you see the synclines in the Landsat images? **ANSWER**
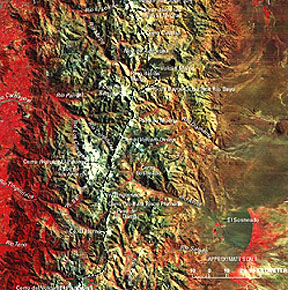
Many folds do not stand out as individuals but are a larger part of continuous folding (and faulting) called orogenic belts or, more commonly, fold belts. There is a more or less continuous fold belt, of varying widths, running from Alaska to the tip of South America. The term “Cordillera” can be applied to this general mountain trend. The belt system is formed along the zone of convergence in which the Pacific tectonic plate is subducted near the edge of the North and South American plates, causing sedimentary rocks along the edge of these plates to crumple (fold) and be lifted up into mountain chains. In South America, the belt makes up the Andes Mountains. In this Landsat image, near Santiago, Chile, the Andes belt has narrowed to less than 120 km, with high plains on either side.
One of the best exposures of a complexly folded mountain belt anywhere occurs in the Atlas Mountain system of northwest Africa. This group is part of the great orogenic belt that includes the Alps, Appenines, the Betic Cordillera (southern Spain), and other chains that we can trace eastward through Turkey into the Zagros Mountains. These belts began to form about 70 million years ago, when the Tethys Ocean (precursor to today’s Mediterranean) started to close as the African Plate moved northward against the Eurasian set of plates. The orogeny climaxed in the late Cenozoic period and is still active.
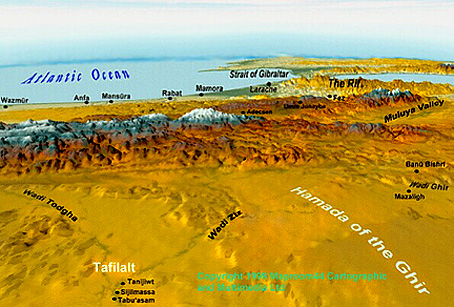
This perspective sketch map of northwest Africa shows the Atlas Mountains in context with the coast of Morocco and the extension into Algeria. Beyond the left end of the map lies the Anti-Atlas segment of this belt. The map includes the Middle Atlas and High Atlas segments, and the Rif mountains east of Tangiers. The mountain chain cuts out moisture coming in from the Atlantic such that this orogenic effect produces the Sahara Desert to the east these high ranges (much like the coastal mountains, Sierra Nevada, and Cascades do in the United States).
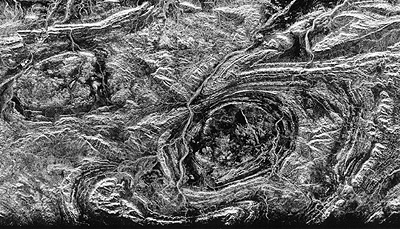
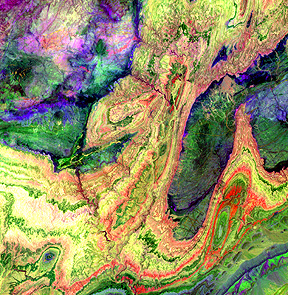
The Landsat scene below covers part of the Anti-Atlas mountains of southern Morocco. In the upper left is a deformed and metamorphosed core of Precambrian rocks against which the tight disharmonic folds of lower to mid-Paleozoic rocks (center) have been shoved northward along thrusts. The white sinuous band against a fold ridge is a dry stream or wadi.
` <>`__2-12: What does part of this Moroccan scene remind you of structurally in some other part of the world? **ANSWER**
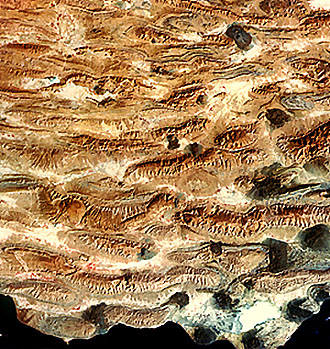
The Atlas mountain belt was also involved in the major closing phase of the Tethys Sea about 80 million years ago, when the African Plate shoved northward, producing the Alps and other European mountains. A portion of the Anti-Atlas is imaged below using three SWIR bands on Terra’s ASTER (see Section 9). Again, the folded structures stand out. The color composite shows various colors associated with rock units: yellow, orange, green, and dark blue denote limestone, sandstone, gypsum, and granite respectively. This is another strong confirmation that IR and thermal remote sensing can distinguish and identify major rock types (where vegetation cover is sparse) with considerable validity.
The High Atlas has peaks reaching above 4500 m (13000 ft). Here it is seen from space in a Landsat mosaic:

These are the highest mountains in Africa and resemble parts of the Alps except that the vegetation is distinctly different. Here is a view taken from Marracech in the south interior of Morocco that typifies the terrain of the Anti-Atlas; below it is a view within the High Atlas segment:

|View from a valley within the High Atlas Mountains. |
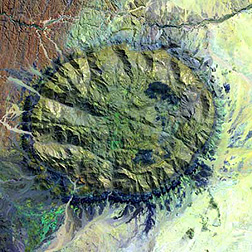
Further south in Africa, in Namibia, is the Branberg Massif, a 21 by 31 km dome that reaches 2.5 km (1.6 miles) in height. A granite batholith intruded into the sedimentary rocks along its side.
On the next page, we look at three illustrations of how we can detect faulting from ground offsets and, more subtly, from discontinuities of landforms. Following that, we illustrate the advantages of space imagery in picking out lineaments (usually fractures in the outer crust that may be faults), together with an appraisal of how these can often be misidentified and misinterpreted. We then close this Section with a practical example of how fracture analysis leads to a successful search for a valuable natural commodity water.