Maximum Likelihood Classification of the Waterpocket Fold; the Saline Valley
Contents
The Waterpocket Fold subscene affords an excellent test of the ability to classify a Landsat scene because most of the stratigraphic units are distinctive, have almost no vegetation cover, and have thin soil cover much like their parent lithologies. A Maximum Likelihood Classification Map made on IDRISI shows generally a favorable level of accuracy for most units. Accuracy is less for shale units in flatter terrain and fairly high on the Fold itself. Earlier classifications of the TM data made using different training sites and the classification algorithms on the IDIMS processor indicate comparable quality of identification for the summer 1984 subscene but poorer accuracy in a winter 1985 subscene that has reduced and lower angle illumination and more shadowing. A trio of images of another scene, the Saline Valley in eastern California, made by the ASTER sensor on Terra, shows that various broad classes of rocks can be distinguished and separated by using visible, SWIR, and Thermal IR bands to make discriminating color composites.
Maximum Likelihood Classification of the Waterpocket Fold; the Saline Valley
Classification of the Waterpocket Fold using the 6 TM reflectance bands in the Summer 1984 image; this was made from the IDRISI program.|
Its classification accuracy is an estimated 70%; that is, the rock units or formations are correctly identified over at least that percentage of surface exposures (chief sources of error: soil cover and similar lithologies). This is high in view of shadow and slope effects, soil cover, and other variables. Among variable misidentifications and conflicts: The Navajo palette color also occurs in the prospect pits and along canyon walls on Tarantula Mesa; black areas such as associated with the localized Carmel/Entrada (combined because of a 15 class limitation) are scattered throughout the scene and generally represent misclassification ambiguities; Kayenta almost disappears in the south except where it shows up incorrectly west of the Chinle (which itself is not well mapped); colors assigned individually to the Morrison/Mancos and, the Masuk and the Emery Formations are dispersed within each other. Note too that the Upper Moenkopi and Shinarump Formation were combined because the latter is too thin in outcrop area to be mapped discretely at this resolution.
` <>`__2-8: What other explanation(s) for the black pattern distribution can you think of; account for the apparent misclassifications associated with the Navajo being elsewhere besides its outcrop ridge on the fold; the Morrison-Mancos unit grades into alluvium in the valley; why? **ANSWER**
There can be considerable subjectivity in setting up and interpreting any classification. Two more classifications of the Waterpocket Fold are shown below to demonstrate how changing factors lead to modified results. Both were made on the IDIMS system at the Goddard Space Flight Center.

The above classification shows the same summer of 1984 scene but applies a different set of training sites and, unlike the one above, includes thermal Band 6. The formations are exceptionally distinct. Red was assigned to alluvium, which, for the most part, was placed correctly (the large section of red occupying the Blue Gate shale member [in blue] of the Mancos formation corresponds to strongly weathered slope wash along steep slopes against Tarantula Mesa). The Dakota formation is a wine purple color (but the white strip near it is of unknown character). The Kayenta is singled out in reddish-brown, and the Chinle is pinkish-peach.
the Waterpocket Fold acquired in the winter of early 1985.|
The illustration above is a classification of a Landsat scene acquired during the winter of 1985. Results are less positive, although many of the units are where they should be. The various formations within the monoclinal limb are discernible but with more irregular outcrop patterns and they include more patches of other units. Note the black patches which are shadows in erosional alcoves. The Moenkopi is not subdivided into upper and lower areas in this winter version. The light grayish-tan patches along the left side of the image mark snow cover.
` <>`__2-9: Compare the summer IDRISI to the summer IDIMS classifications; why does the second (lower) IDIMS classification seem less accurate than the one above it; account for the black patterns in this second version.` <Sect2_answers.html>`__**ANSWER**
On the whole, the Waterpocket Fold has proved an exceptional test site. Its field characteristics are especially suited to enhancements like PCA and ratioing. The abundant exposures of rocks rather than soil and vegetation cover make discriminating them easier and hence improve the classification’s accuracy over most geological units, particularly those in areas where the units are hidden by weathering products and organic growth. As we have always known for aerial photographs, space imagery has limited value for direct mapping in vegetated terrains, so that field observations requiring on-site inspection and even digging remain the traditional way to map rock units.
` <>`__2-10: Why aren’t rock units (formations) as easy to map in the eastern U.S. as in parts of the West; what might cause mapping problems in desert areas such as in Utah? `ANSWER <Sect2_answers.html#2-10>`__
After this Section was prepared, a new set of very impressive images that deal with rock type identification were released from the on-going Terra satellite program which is the kingpin of the Earth Systems Enterprise (see page 16-6). Although the main objectives of the ESE international effort is to get co-ordinated information about the atmosphere-oceans-biosphere interactions, with geologic studies remaining subordinate, several of Terra’s sensors are proving very sensitive to certain characteristics of the land surface that translate into still another approach to stratigraphy and mineral exploration.
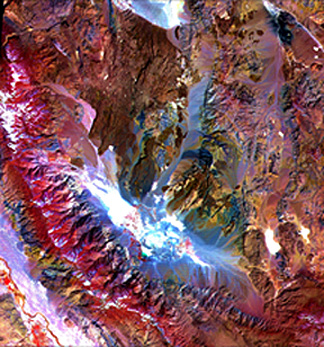
This is supported by three images from the Terra’s ASTER sensor, shown below as color composites. The area imaged is the Saline Valley which lies to the west of Death Valley and is hemmed in by the Inyo Mountains to its west and the Eureka Range to its east. At the top is a false color composite (15 m resolution) made from ASTER Bands 3 (0.81 µm), 2 (0.76 µm), and 1 (0.61 µm) as red, green, and blue (RGB) respectively. In the image, red is vegetation, snow and sand are white, and rocks are gray, brown, yellow, and blue.
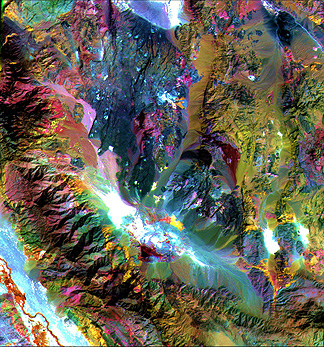
The next ASTER image is made with the SWIR Bands 4 (1.65 µm), 6 (2.205 µm), and 8 (2.23 µm) as RGB. Limestone appears in yellow-greens and rocks altered to kaolinite as one of the clays are purple. Image resolution is 30 m.
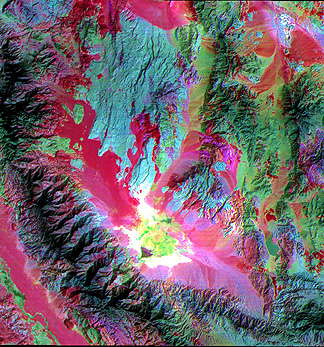
ASTER also has several thermal channels. The image below is made from Bands 13 (10.6 µm), 12 (9.1 µm) and 10 (8.3 µm) as RGB. Resolution is 90 m. In this rendition, silica-rich rocks are red, carbonates green, and silica-low (mafic) rocks are purple.
With ASTER and other Terra sensors now on active duty, and hyperspectral sensors (Section 13) becoming spaceborne in the near future, the ability to distinguish various rock types has become an effective reality.