True Color View
Contents
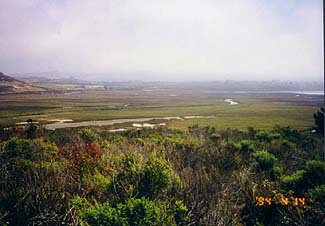
By projecting TM Bands 1, 2, and 3 through blue, green, and red filters respectively, a quasi-true color image of a scene can be generated. One is shown on this page, but if you are familiar with color aerial photos, you will likely protest that these are not the real colors you would see in such photos. That is correct, but at the least, vegetation appears green yet the ocean water is not the expected blue. Very careful processing of the Landsat data can improve the quality of a true color rendition (the Idrisi program only approximates this). Still, note the similarity between the Landsat expression of the marshland, and the general color seen in a ground photo. The identity of the mystery feature is finally exposed on this page, along with a supporting ground photo.
True Color View
The next scene displays the Morro Bay region in quasi-natural color, achieved using the IDRISI processing system by assigning TM Band 1 to the blue, Band 2 to the green, and Band 3 to the red color source.
In practice, we use various color mapping algorithms to facilitate visual interpretation of an image, while analytical treatment usually works with the original DN (digital number) values of the pixels. The original DN values contain all of the information in the scene and though their range of values may make it necessary to remap them to create a good display, it doesn’t add information. In fact, although visual interpretation is easier with the remapped image, remapping loses and distorts information thus, for analytical work, we use the original DN values or DN values translated to calibrated radiances.
With this mapping, we see a pleasing and satisfying image because it depicts the world in the general color ranges with which we are naturally familiar. We can imagine how this scene would appear if we were flying over it at a high altitude.
We might comment that the ocean appears too dark in the IDRISI TM composite. This darkness is due to its general darkness in all of the bands, the consequence of water absorbing light from most of the visible range and, to a lesser degree, to the algorithm that IDRISI uses to combine three 8-bit bands into a single 8-bit composite image. (We see color in the ocean when we are on the ground partly because of some angular reflection and because of reflection of blue sky when clouds are sparse). The notable exception is, of course, related to the breakers (here, with little internal structure) that are highly efficient at scattering light. The sediment patterns noted vary through bands 1 to 3 are clearly separable (rather than gradational) in this color rendition, with areas of greater load density having some green input (Band 3 [red] shows only the densest sediment areas). Note especially the dark brownish-green tones by the delta where the coastal marsh develops, interpreted as a heavy load dumped at the mouth of the small river (**p**) flowing over it.
Probably the most unrealistic color in the rendering of the IDRISI version of this “true color” scene is the bright hill slopes. In this rendition, the base color is tan with some purplish overtones, but there are small areas and patches marked by a darker brown tone which, if inspected at ground level would have some green tints. The color composite shows these surfaces in a somewhat misleading way. From an airplane, we might describe these surfaces as a light golden-brown (from the dry grass, one reason California is often called the “Golden State”), similar to the terrain shown below which matches the first version’s color mapping more closely.
The reason for the red-brown-purple color is that light from surfaces at certain orientations contribute considerable red from Band 3, some blue (hence purple) from Band 1, and little green from Band 2.
The areas we presumed to be active grasslands (**v**) appear in “true color” as a slightly reddish brown. Areas correlated with fields and meadows are a medium brown. Most areas that were associated with medium to dark reds in the false color composite are very dark in the natural color version. This is particularly valid for the National Forest growth around (**u**), the stream-lining vegetation (**i**), and the wooded patches (**l**) scattered throughout the scene. The diminution of green color is explainable as follows: most of this vegetation is either California oaks, which have dark green leaves, or perhaps some evergreens which tend to be less reflective than deciduous plants, thus the dark brown color. These leaves, or needles, have generally lower reflectance in Bands 1-3 but still are proficient reflectors (from cell walls) in Band 4.
The coastal marsh (**o**) appears as a dark brownish-red in this true color rendering (as it seems to do in the aerial oblique photo). At least part of this effect may link to types of vegetation which were envisaged in the photo shown on page 1-2 that indicates reddish tones in many of the plants. Another view of the marsh, with its outlet on the bay, is presented here; note the rather brownish tones over much of its expanse:
Now, lets return our attention momentarily to the mystery feature. Last chance to identify it! It appears again in this high altitude aerial photo of Morro Bay (town and water) distributed by the U.S. Geological Survey:
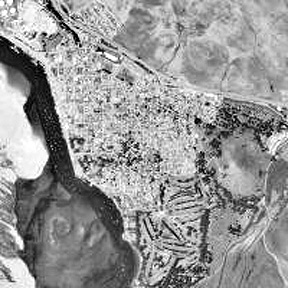
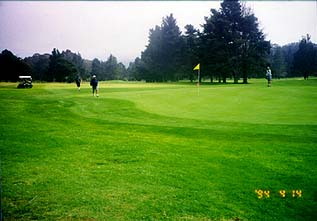
In the natural color Landsat subscene at the top of this page, the mystery feature displays as a collage of bright green, arranged as we saw earlier in the black and white enlargement roughly in elongated strips. If you haven’t deduced its identification already, we now reveal that it is an 18-hole golf course. The aerial photo shows the links at its bottom center. Hole Number 18 is pictured in this ground view:
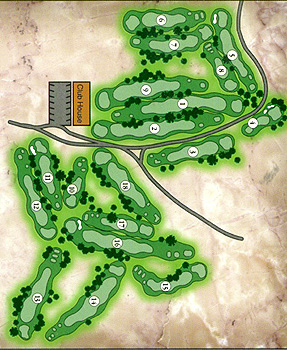
Let’s repeat the Landsat enlargement in false color and then show a map of the greens as printed on the official scorecard which the writer picked up at the Pro Shop. It is rotated 90° clockwise to align with the Landsat subscene.
We have also extracted the portion of the digitized aerial oblique photo, that contains this tract, known as the Morro Bay Golf Course on State Park Road. This photo shows the lighter green fairways amidst darker green trees in close-up. One patch of trees (many being the Eucalyptus, imported from Australia, that has spread so widely that it is almost a commonplace pest), hides luxorious Condominiums built since the aerial photo was taken. The two bright patches within the image are sand traps. Their exagerated size in the photo is misleading, in that even if they are actually smaller than the 30 m resolution of a TM pixel containing one of them, the great brightness each contributes swamps the reflectance response of other classes in that pixel, making it appear overly light. This same phenomenon was observed early in the Landsat program where small [less than 8 m {26 ft} wide] dirt roads passing through sage brush or grasslands could be resolved because the pixels containing these pathways were substantially brightened.)
There are several parts of the image that contain distinctive orange-brown tones (as at **x**). This coloration is apparently due to soils that have a rich brown color. We also see this brown tone in the valley north and east of Los Osos and in part of that town. This valley appears to have its own small stream, which is not easily resolvable, or perhaps it once had a larger stream, which is now gone. Such a valley is probably underlain by alluvial deposits that typically are browner (enhanced by hydrous iron oxides similar to rust).