Meteorological disasters occur frequently in the Belt and Road region. Among the 10 countries most severely affected by meteorological disasters in the world, 7 of them are in the Belt and Road region. It is of great significance for studying meteorological disaster events and reducing disaster risks to know the historical meteorological conditions of this region and to know the spatial and temporal distribution rules of meteorological indexes such as temperature and precipitation in this region. This knowledge application is based on WorldClim's historical meteorological data after compilation, extraction and mapping, reflecting the three indicators of the monthly maximum temperature, monthly minimum temperature and monthly total precipitation in January, April, July and October in the Belt and Road region in 2018. It is of certain significance for users to understand the basic meteorological rules of the region and to serve the prevention of meteorological disasters.
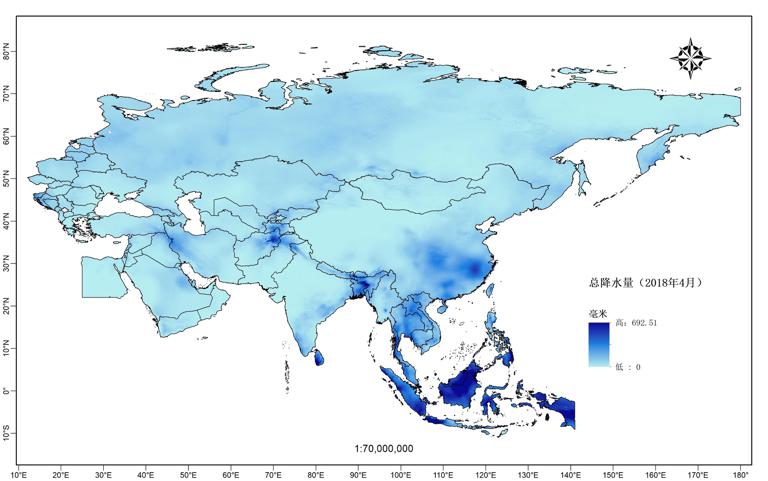
Historical meteorological data comes from the monthly historical weather data set of WorldClim. This data set is downscaled from the CRU-TS-4.03 data set and obtained based on WorldClim2.1 error correction. The data set has a global spatial range, a time range from 1960 to 2018, and a spatial resolution of 2.5 ', which is about 4,600 meters. And it includes three variables: monthly maximum temperature, monthly minimum temperature and monthly precipitation. Using ArcGIS spatial analysis and processing tools such as cropping and mapping, the monthly maximum temperature, monthly minimum temperature and monthly precipitation in January, April, July and October of 2018 in the Belt and Road region were mapped. The figure below shows the monthly precipitation in April 2018.
Comment list ( 0 )

