
Map digitization
Summary
Maps are always an important form of information, whether ancient, modern or future. Before computer graphics technology is applied to map production, all departments generally use paper maps or engineering drawings, paper drawings are manual operations in terms of review, calculation of distance and labeling of place names; in addition, it is not possible to modify, reduce the scale and layered the reading of a piece of paper map, as for the partial enlargement of the map, only the magnifying glass can be used, and the enlarged area is small and the operation is inconvenient.
With the development of technology, people’s requirements for maps have been further improved. Because traditional paper maps have low efficiency, speed and precision, it is difficult to adapt to modern and future technological developments. With the GIS tool, the paper map can be converted into an electronic map that can be displayed on the screen through a series of processing, which can meet the new requirements of people using the map.To facilitate discussion of the problem, the vector electronic map is defined as follows:
When the paper map is quantized into a bitmap digital image by computer graphics system, the image processing and curve vectorization, or directly by hand-held tracking digitization, the generation can display, modify, mark, roam for the geographic information system. A vector map data file that is calculated, managed, and printed. This computer data file corresponding to a paper map is called a vectorized electronic map. This kind of map work requires the support of application software and hardware systems, the operation of the vectorized map is realized by human-computer interaction and control of the hardware device by the GIS application software.
With the support of hardware systems and corresponding GIS software, vector electronic maps have the following advantages over paper maps:
. Calculate the distance and label the place name symbol quickly and accurately;
. It can zoom in on the map, zoom in and out, and display the roaming function.
. Display the map hierarchically (when the various information on the map is stored in different layers, you can display some layers and close the layers that are not displayed);
. The information can be edited and modified in units of primitives, human-computer interaction draws line symbols, and deletes redundant information on the map;
. The electronic map can be transmitted through the computer network to provide information sharing, and the transmission speed is fast and the confidentiality is strong;
. If the problem of automatic segmentation and recognition of map symbols can be effectively solved, the intelligent vectorization of the map can be realized. Intelligent here refers to automatic vectorization and automatic labeling, optimal path optimization and automatic tracking of targets.
Vector electronic maps have the following advantages over bitmap imagery:
. The file size of the former is relatively small under the same amount of information, and the more complicated the figure is, the more obvious the performance is;
. The former can edit and delete information in units of primitives, and human-computer interaction draws line symbols; the latter can only copy, move and delete in pixels as a basic unit (such as a rectangular image block), that is, its editing function is very poor;
. The former can display all the elements in layers, and the latter can only control the window display of a certain area (rectangular area) of the whole picture.
Map data type
The above-mentioned materials collected for the purpose of map automatic mapping should be adapted to the needs of computer processing, at the same time, it is necessary to consider the passage of these materials, and finally obtain map data of various natures.
For this reason, map data can be defined as a digital set of load geographic information. They should refer to the geographic information that is input into a certain computer system for processing and can be regenerated when necessary. In this sense, map data can be divided into:
1) Spatial data (or graphic data)
Spatial data is the geometry that makes up the elements of the map, such as wells, mountains, lighthouses, rivers, roads, contours, lakes, forest boundaries, and soil type boundaries on the map. In order to represent the positioning features of the spatial patterns of these elements on a two-dimensional plane, a pair of plane rectangular coordinates (X, Y)is commonly used to represent the map data, which is called vector data; or use it to represent the lower left corner coordinates (rows and columns) of the grid cell, which is called raster data.
Map element graphics can be roughly divided into three basic types: point, line and surface.
Faces - represented by lines surrounding them; or by points in their area;
Line - a set of discrete points;
Points can be determined by a pair of coordinates in a plane coordinate system.
In practical applications, only coordinate data is not enough, and must be distinguished by special coding according to the meaning of different map elements.
2) Semantic data (attribute data)
Semantic data is also known as non-geometric data, including qualitative data and quantitative data. Qualitative data is used to describe the classification of features or to label features. Quantitative data is the nature, characteristics, or strength of an element, such as distance, area, population, yield, income, flow rate, and temperature and elevation.
For semantic data, it is basically a geocoding problem. Based on the scientific classification and classification system, the basic entities and their relations in the geographic environment are coded so as to uniquely recognize and process all map elements in a system, this function is very important not only in the user environment but also in the computer system.
At present, it is impossible to establish a universal coding to meet all the needs of all aspects. Therefore, the most realistic thing is to develop diversity coding to meet the different needs of various departments, while taking into account the requirements of establishing a database, generally speaking, some basic requirements of coding include:
(2.1) Categories of elements, such as place names, entity types and ranks;
(2.2) Elemental feature (Attributes) - Each feature may have a large number of attribute values associated with it that carry information about feature characteristics;
(2.3) Description of the scope of action - for example, the type of soil in an area;
(2.4) Geographical definition - In some cases, coding can be an indirect reference to a set of entities, and each entity in the set will be explained by its own geographic code, such as the coding of water systems and geological formations.
In the process of GIS data entry, spatial data entry is more important, because processing spatial data and spatial information is the core function of GIS. Compared with attribute data entry, spatial data entry is more work-intensive and requires the support of GIS software tools (with common database software for attribute data entry).
Digitalization of digitizer
Handheld tracking digitization
Despite the heavy workload of Manual Digitising, it is still the most widely used means to digitize existing maps.
Use the hand-held tracking digitizer to enter coordinates for points, features, and polygon boundaries. The specific input method is related to the implementation of GIS software. Other GIS systems also support the input of non-spatial information by digitizer, such as the height of the contour line, the coding value of the feature, etc.
** Handheld tracking digitizer communication and parameters: **
Handheld tracking digitizer is connected with computer through RS-232 (serial port) interface, in order to transmit and receive data correctly, it is necessary to set communication parameters, including baud rate, data bit, check bit, stop bit and so on. In addition, the digitizer also includes coordinate origin, resolution, sampling mode, data format and other parameters. The parameters of digitizer can usually be determined by switch and menu on digitizer board. In order to ensure the correct data entry, it is necessary to set the parameters of the digital software in accordance with the digitizer.
Before digitizing, it is necessary to determine which information needs digitizing, at present, because most GIS software adopts hierarchical management of spatial data, it is necessary to determine which layers are input and the specific content of each layer. In addition, since the digitization process cannot be completed at one time, the position of the map between the two inputs may be shifted relative to the digitizer, so that the coordinates entered twice before or after are shifted or rotated. The solution to this problem is to enter at least three Tick Marks, or Register Points, before each entry, which are fixed relative to the map, so that the contents of the two inputs can be matched according to the relationship between the coordinates of the anchor points.
Generally, digitizer uses two kinds of digitization methods, namely Point Mode and Stream Mode, Point mode is to send the coordinates of a point to the computer when the input person presses the button of the downstream mark. Point input mode must be used when inputting point features, while point input mode can be used for inputting line and polygon features, when inputting, the inputter can selectively input the sampling points on the curve, and the sampling points must be able to reflect the characteristics of the curve.
Streaming mode can speed up the entry speed of line or polygon features. During the input process, when the input person moves the cursor along the curve, the coordinates of the passing point can be automatically recorded. When enter the curve with the flow mode, the number of collection points is often more than the point mode, resulting in excessive data volume, one solution is to sample the recorded points in real time, that is, although the system receives the coordinates of the points, it can be sampled according to the sampling, the principle determines whether to record the point [1]_.
At present, most systems adopt two sampling principles: Distance Stream and Time Stream (Fig. 6-1).
The distance flow mode is that the distance between the currently received point and the previous point exceeds a certain threshold, and the point is recorded;
The received points are sampled at regular intervals with the time stream method.
One advantage of time-stream input is that when the input curve is relatively smooth, the input personnel tend to move the cursor faster, so that the number of recording points is less; when the curve is more curved, the cursor moves slowly and the number of recording points is more. When the distance flow method is adopted, it is easy to miss the curve inflection point, thereby distorting the shape of the curve. Therefore, in terms of ensuring the shape of the curve, the time flow mode is superior to the distance flow mode.
In the actual input process, different input methods can be selected according to different input objects. For example, when inputting a plot map, because its boundary is mostly straight line and the data of points is less, the point method can be used; when inputting a traffic line, the point method can also be used to ensure the accuracy of the location of some characteristic points; and because of the large amount of data, the flow method can be used to speed up the inputting of contours.
Other vector data entry methods:
Although hand-held tracking digitization is the most important input method of geographic data in vector format at present, in some cases, other data input methods can also be used:
Other data conversion:
Conversion of data in other formats includes three scenarios:
Conversion of other vector format data (often formulated by other GIS software);
The coordinate data are often expressed in the form of relational database tables (Table 6-1).
Location description information, accessed in the form of relational data tables, can also be converted into less precise coordinate data (Table 6-2).
Table 6-1: Station information table (Part)
Station coding |
Longitude |
Latitude |
68013344 |
107.2 |
29.8 |
68026785 |
115.5 |
30.2 |
Table 6-2: Employee information sheet (Part)
Full name |
Address |
Zhang San |
Haidian district, Beijing |
Li Si |
Shijiazhuang City, Hebei Province |
Keyboard entry:
Keyboard input can be used when the amount of data is small and the precise coordinates of the objects are known. In addition, keyboard input is also the main means to input attribute data.
Mouse input:
If you don’t want to track the digitization, but scan vectorization is difficult to identify the ground object, you can use the mouse to enter, usually after scanning the map, as the base map is displayed on the screen, and the base map is used to draw points. Since the mouse positioning is not as accurate as the digitizer, it is generally used to input some schematics.
Other fixed-point measuring equipment:
At present, GPS has become a popular positioning and navigation equipment, which can also provide coordinate data in vector format for GIS. Other fixed-point measuring devices include flat-panel plotter, etc, the most important thing is to consider the accuracy with these devices.
Curve discretization algorithm
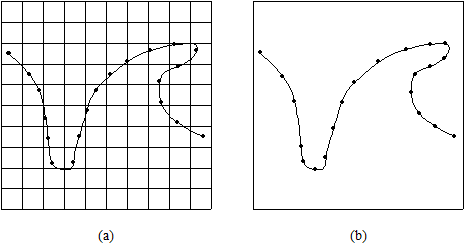
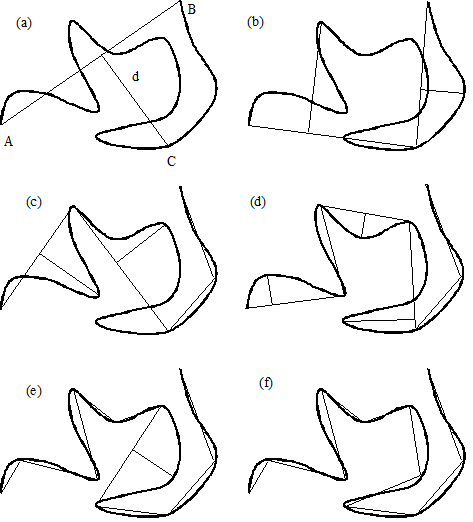
In the process of digitization, it is necessary to simplify the sampling of curves, that is, taking a finite number of points on the curve, turning it into a broken line, and maintaining the original shape to some extent. The Douglas-Peucker algorithm is described below (Figure 6-2).
Connect a straight line segment ABbetween the two points A, Bat the beginning and the end of the curve, which is called the chord of the curve;
Obtain the point *C*which is the largest distance from the straight line on the curve, and calculate its distance d from AB;
Compare the distance with the predetermined threshold * ε * , if it is less than * ε * , the straight line segment is taken as an approximation of the curve, and the segment is processed;
If the distance is greater than the threshold, divide the curve into two sections ACand BCwith Cand perform 1-3 steps on the two sections respectively.
When all the curves have been processed, the fold lines formed by the respective split points are connected in turn, which can be used as an approximation of the curve.
Obviously, this algorithm is a recursive algorithm.
Scanning vectorization and common algorithms
Scanning vectorization and processing flow
As computer software and hardware become cheaper and provide more functions, the cost of spatial data acquisition has become the most important component of GIS projects. Because the digitalization of handheld tracking requires a lot of manual operation, it becomes the bottleneck of the application project with digital as the main body. The emergence of scanning technology undoubtedly provides a powerful tool for spatial data entry.
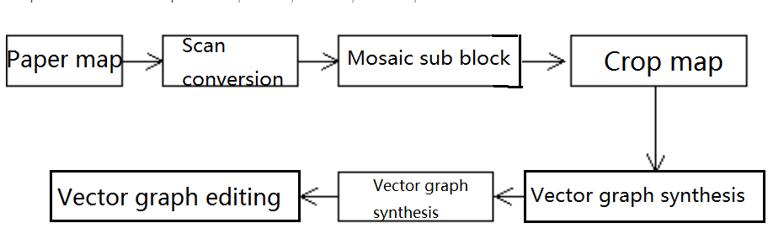
The common process of map scanning is shown in Figure 6-3. Because the scanner’s scanning area is generally smaller than the map’s, large paper maps need to be scanned in blocks and then docked with adjacent maps; when the resolution of the display terminal and the memory are limited, the spliced digital map is also cropped into a plurality of normalized rectangular blocks, vectorization processing is performed on each rectangular block to generate a vector map for editing, finally, these vectorized rectangular tiles are combined into a complete vector electronic map and edited, modified, annotated, calculated, and roamed.
In the post-processing of scanning, the operation of raster rotation vectors is needed, which is generally called the process of scanning vectorization. Scanning vectorization can be carried out automatically, but the scanned map contains many kinds of information, which makes it difficult for the system to recognize and distinguish automatically (for example, in a topographic map, there are contours, roads, rivers and other line objects, although different objects have different lines and colors, it is still difficult for the computer system to distinguish them automatically), which makes it completely automatic vector, quantization results are not so “reliable”, so in practical applications, interactive tracking vectorization, or semi-automatic vectorization, is often used.
Converting a raster image to a vector map generally requires the following sequence of steps [Musavi 1988]:
1) Image binarization (Threshold)
Image binarization is used to calculate a black and white binary image (Binary Image) from the original scanned image, and the grid point of the white area on the image is usually assigned a value of 0; the black area is 1, and the black area corresponds to the feature to be vectorized and extracted, also called the foreground.
2) Smooth
Image smoothing is used to remove random noises in images, usually as speckles.
3) Refinement
Refining refines a line to only one pixel wide, refinement is an important step in the vectorization process and the basis of vectorization.
4) Chain coding
Chain coding converts the thinned image into a set of point chains, where each point chain corresponds to an arc.
5) Vector line extraction
Convert each point chain into a vector line, each line consists of a series of points, the number of points depending on the degree of bending of the line and the required accuracy.
In addition to the above five steps, some processing is needed to facilitate the image vectorization process, such as image stitching and cropping, etc., the operations and related algorithms are described below.
Image mosaic/clipping
1) Image stitching
Based on the partial overlap of two adjacent map images, the process of synthesizing them into a whole picture is called image stitching, which is divided into upper and lower stitching and left and right stitching. Taking the left and right splicing as an example, take a rectangular area A on the right edge of the left picture and a rectangular area B on the left edge of the right picture, if A and B have certain overlapping areas, the computer can be automatically matched, the splicing algorithm is as follows:
(1.1) Take a number of columns L1(O), L1(1),…,L1(n) from right to left in the right edge of A, with the length sequence of the pixel grayscale in each column as the feature vector. Find the feature vector V1(O), V1(1),…,V1(n)of each of the above columns.
(2.2) Automatic splicing is to take a number of columns L2(n), L2(n-1),…, L2(O) from left to right in the left side of B, with the length sequence of the pixels in each column. For the feature vector, the feature vector V2(n) of the above columns is obtained: V2(n-1),…,V2(O). If the vector sequence [V1(O);V1(1),…,V1(n)]and [V2(O),V2(1),…,V2(n)]matches, then go to step 4.
(2.3) Manual splicing means that A is fixed, and B is moved up and down and left and right by a certain step by human-computer interaction until the overlapping areas of A and B are aligned.
(2.4) Correcting and synthesizing two adjacent map images according to the matching condition of step 2 or the offset condition of step 3.
2) Image cropping
The process of cutting an image into two adjacent ruled tiles is called map cropping. Image cropping is very simple. In practical applications, image cropping technology can be determined and not used according to different hardware configurations.
Image thinning preprocessing binary image smoothing
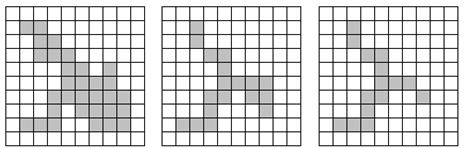
When the map is scanned or captured, due to the unevenness of the line and the limitation of the resolution of the scanning and camera system, some curved targets bring extra small branches (ie, glitch noise); in addition, there are holes and dent noise, as shown in Figure 6-4. If these noises are not removed before refinement, it will cause refinement errors and distortion, which will eventually affect map tracking and vectorization.The wider the curve target, the more times it takes to extract the skeleton and remove the contour, so the noise effect is greater.
Burrs and holes in the scanned image
In order to remove the influence of burr noise, the 3 *3 template as shown in Fig. 5 can be used for processing. The process is to scan each pixel on the image in a dot matrix format, as long as the corresponding area of the image matches the template in Figure 6-5 (including the template formed by its three 90:sup:0rotations), which is determined to be a glitch, and the pixel value corresponding to the center of the template becomes 0. This matching operation can be performed as many times as needed.
0 |
0 |
0 |
0 |
1 |
0 |
Ⅹ |
Ⅹ |
Ⅹ |
Figure 6-5: Deburring template, X arbitrary value
In order to remove the hole and depression noise, We use the template shown in Figure 6-6 for processing, as long as the corresponding area of the image corresponds to the template (including its cubic 90).O Rotate) Match, then the area center point value becomes 1.
X |
1 |
X |
1 |
0 |
1 |
Ⅹ |
Ⅹ |
Ⅹ |
De-caving template
In a word, through the above two smoothing methods, the influence of burr and hole depression noise is basically eliminated, which lays a foundation for further refinement.
Thinning
The refinement algorithm processes the binary image to obtain a refined image. Line refinement is an important technique for processing binary images containing linear features, in the map scanning process, since the main information on the map is different thickness and different shape lines, the line refinement must be performed first to be accurate and effective, these line information is extracted and the tracking vectorization is further completed.
Line thinning is the process of continuously removing contour pixels that do not affect the connectivity of the curve, the General requirements for line thinning are as follows:
Guarantee the connectivity of refined curves
The thinning result is the center line of the original curve.
Retain thin line endpoints
According to various applications, many line thinning algorithms have been proposed, such as the inner circle method, classical algorithm, asynchronous algorithm, fast parallel algorithm and parallel octagonal algorithm, different algorithms have their own characteristics in processing speed and effect.
Following is a common thinning algorithm, the other algorithms are basically the improvement of this algorithm.
First introduce several related concepts and symbols. For each pixel in the binary raster image p, and the 8 pixels directly adjacent to the pixel (Figure 6-7), order:
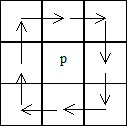
N(p)is the sum of the values of the neighbors of p;
Image pixel connection number T(p), if you rotate to see the point around the pixel, T(p)is the number of times around 8 points from 0 to 1 in the *p*It reflects the number of blocks connected to the pixel’s neighbors (Figure 6-8).
p:sub:`W`,p:sub:`E`,p:sub:`S`,p:sub:`N `refers to the value of the left, right, bottom, and top neighbors of the pixel.
The algorithm steps are as follows [Zhang-Suen, 1984]:
1: For each point P in the raster image, the following operations are performed:
If 2≤N(p)≤6and T(p)=1and p:sub:`N`p:sub:`S`p:sub: `E`=0and p:sub:`W`p:sub:`E`p:sub:`S`=0
Then mark point P;
2: All marked grid points are assigned to 0, and if there are no marked points, the algorithm ends.
3: For each point P in the raster image, the following operations are performed:
If 2≤N(p)≤6and T(p)=1and p:sub:`N`p:sub:`S`p:sub: `W`=0and p:sub:`W`p:sub:`E`p:sub:`N`=0
Then mark point P;
4: All marked grid points are assigned to 0, if there are no marked points, the algorithm ends.
5: Turn to the first step.
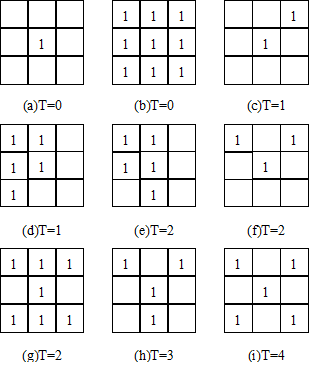
Figure 6-9 shows the process and results of refinement using this algorithm.
Chain code (Freeman code)
The chain code is a method proposed by Freeman to describe the binary line graph by using the curve starting point coordinates and the slope of the line. Figure 6-10(a) shows the eight directions of the chain code and their serial numbers. The chain code of the thin line of Fig. 6-10(b) is (3,0) 21100066567, where (3,0) is the starting point coordinate, and the subsequent numerical sequence describes the direction.
Any thin line can be represented by a chain code sequence as follows:
C=a:sub:`1`a:sub:`2`…a:sub:`n`,0≤a:sub:`i`≤7
If the starting point A1 coincides with the ending point an, the curve is closed.
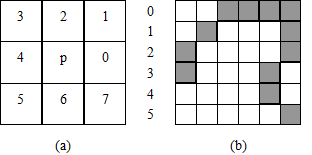
(a): 8 directions of chain code; (b) thin lines
Vector line generation
The last step of Scanning Vectorization is to generate vector lines, which can easily convert each chain of chain coding into a vector line. Naturally, curved vector lines require more points than straight lines, depending on the required accuracy. Douglas-Peucher algorithm can be used in the process of vector line generation.
At present, automatic scanning vectorization is not completely reliable, in order to improve its reliability, more research needs to be done on pattern recognition.
