Contents
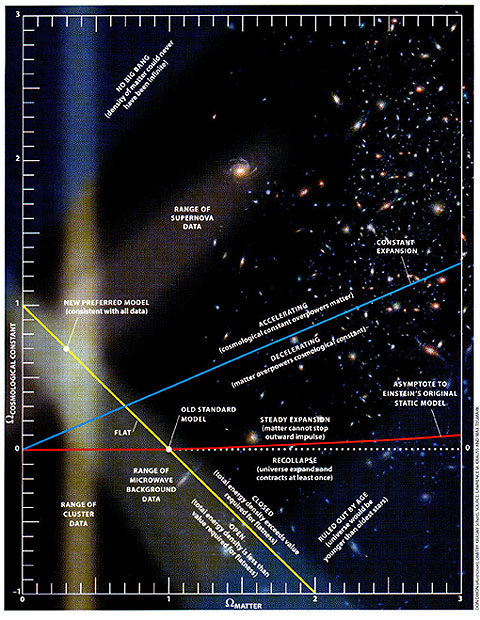
Some of information on this graph, developed for the article by Lawrence Krause of Case Western Reserve University in theJanuary 1999 issue of Scientific American, has been examined in similar graphs on the previous page. Six further comment: 1) the vertical axis denotes the density of the energy associated with the Cosmological Contant; the horizontal axis refers to matter density; 2) the yellow line is a plot of the possible combinations of ΩΛ and ΩM; it defines a Flat Universe and is a boundary between Open and Closed Universe; 3) the blue line divides Accelerating and Decelerating Universes, determined by the numerical difference between the two Ωs, which leads to a statement about the relative strengths of gravity and expansion, thus indicating how expansion rates vary with time; 4) the red line predicts the long term history of a Universe that expands steadily; 5) the lower yellow dot describes a Standard Model Universe with no Cosmological Constant affecting it, and 6) the upper yellow dot positions a Universe with the current best estimate of the dark energy density at ΩΛ = 0.7.