Space-Time and Expansion of the Universe
Contents
Space-Time and Expansion of the Universe
Shifting our attention to the creation of space aspect of the Big Bang model: The Bang effect, starting from a singularity, requires that all matter created (photons, atoms; subatomic particles) moves apart systematically in a continuously expanding Universe. Galaxies, each holding a fraction of this matter (as gas and dust), are receding from one another over a range of velocities (as demonstrated by the spectral red shift phenomenon [see next page]) that depend on their relative proximities and on their apparent ages as a function of distance. The apparent age of a given galaxy (remember, most galaxies started to form early in cosmic time [first 1 - 2 b.y.], which is their real age) when the astronomer sees it is just the time elapsed for light to have traveled (at ~300,000 km/sec [186,000 miles/sec]) the total distance it is now from Earth. Thus, if a galaxy is shown (see page 20-9) to be 9 billion l.y. away today (a distance of ~8 x 10¹⁹ kilometers), light has taken that long to get here and the galaxy must therefore have been in existence at least 9 b.y ago (and likely longer, perhaps to the first billion years of the Universe). We see this galaxy as it was then, in an earlier or younger stage of development, not as it has since become up to our time. i.e., is now. That galaxy has changed during the last 9 billion years, as stars within it have burned out and new ones formed. If somehow we could image the galaxy in its present (current) state, it would appear different from what we can actually see that represents its state 9 billion years ago.
Of course, that galaxy and the Earth (within the Milky Way) were much closer to each other 9 b.y. ago and have continued receding from one another since. Today the galaxy is much further away from Earth and light leaving it now will take much longer than 9 billion years to reach us. In the early moments of the Big Bang, the two galaxies were indeed very close, as were all galaxies including those now at maximum observable distance from Earth; since then the two have separated a distance specified by that covered by their mutual travel and increasing over the 9 billion light years of expansion. This seeming paradox is addressed by applying Einsteinian concepts of gravitationally moderated space-time (his theory of General Relativity). The age we assign to a galaxy at any distance from Earth depends on its distance (in light years) and the age chosen for the beginning of the Big Bang. To calculate this: Age we now see = Stage of Development = Age of Universe - Time elapsed during the travel time of light [l.y.] from galaxy to us. Assuming the Universe’s age to be 15 Ga (recall that a “Ga” refers to Giga-annum or a billion years), the galaxy 9 Ga away shows us today what it looked like at 15 - 9 = 6 Ga after the Big Bang.
Perhaps a diagram will aid in comprehending these ideas of the effects of expansion on the perceived ages of galaxies at different distances:
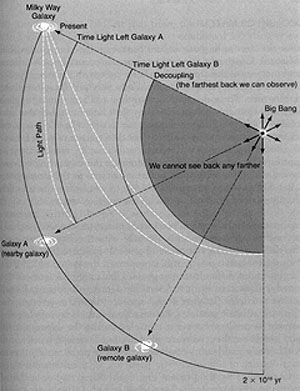
From J. Silk, The Big Bang, 2nd Ed., © 1989. Reproduced by permission of W.H. Freeman Co., New York
In the diagram, the Big Bang itself is the zero point in time and space on the right end of the arcuate wedge diagram. Both straight lines from this point are non-linear time lines (the one on the right ends at 20 billion light years; an upper limit for the age of the Universe chosen arbitrarily by Professor Silk as a maximum estimate at the time he fashioned the figure - now an age based 15 billion l.y. is believed to be more realistic; the line on the top shows in words major events during the Universe’s history). The long circular arc can be thought of both as a distance measure and another expression of the time involved in light speed travel of photons from any point on the curve to observers on Earth in the Milky Way. The shaded area lies within the 300,000 year span from the Big Bang moment until the end of the Radiation Era - any event in the then smaller Universe is forever hidden from detecting/monitoring by the opacity of early Universe prior to Decoupling (see page 20-1. The first luminous matter to form after this Era (300,000 to 500,000 years after the Big Bang) has taken just under 20 (think 15 hereafter) billion years to get to Earth, covering a distance of 15 (minus 0.5) billion light years as traced by the long white curved line. Galaxy B as seen appears several billion years younger (that is, is in a stage of development at, say, 3 billion years after the B.B., so that the distance traveled by its light path (white) is less. Galaxy A seems much younger still in terms of when its light left it for Earth; the light path is shortest.
Nevertheless, both Galaxy A and B can be nearly the same actual age, since the bulk of the galaxies are believed to have organized over a time interval of a 1-2 billion years at most after the Big Bang. (However, keep in mind that many astronomers believe that some (possibly many) galaxies have formed at various times subsequent to the era of main galaxy formation - about a billion years after the Big Bang - and would thus appear younger [in earlier stages of evolution] at various distances from Earth within the 4 dimensional mix of galaxies distributed throughout the expanding Universe.) But, in fact the appearance of Galaxy B shows it to be in an earlier stage of development than Galaxy A. This seeming paradox is simply the relativistic effect of time of travel: B took longer to get here because it is further away and at the time of departure was developing at an earlier time in Universe history. Light from A left later, when that galaxy was in a stage of evolution that appears further along, and has traveled a shorter distance, being located also closer to the Milky Way (B is further away because it is located among those galaxies that have been receding from Earth as an observation point at faster rates; see below).
Now, consider this thought experiment: Suppose you peer through a telescope one night and happen to see the moment of detonation - the earliest stage - of 3 supernovae. They all will disappear as bright object within thousands of years. You might conclude that they all were happening right now or at least recently. Measuring the recessional velocity redshift of each, from which distances to observer can be calculated, you find that Supernova A is 2 billion l.y. away, B is 7 b.l.y from Earth, and C is 12 b.l.y distant. This last supernova actually occurred 12 billion years ago, the others 7 and 2 billion years ago respectively. They are indeed not simultaneous events, and all three in today’s time have no trace of their existence (some of their materials have been incorporated in other stars and the rest are dispersed in intra- and inter-galactic space). Yet, as you witnessed them suddenly appear, you might conclude they were happening NOW - not so. The one distinction among them is that the luminosity of the three decreases in the time-distance sequence from brightest A, then B, and C with the lowest luminosity; this is simply the effect of increasing distance making objects of similar absolute magnitudes progressively decrease their apparent magnitudes.
For the sake of clarifying further, form a mental picture of the galaxies (represented by dots in this visualization) spread uniformly throughout a spherical Universe (which as you will see on page 20-9 is just one of several spatial configurations) with Earth arbitrarily at the center. If those furthest along in evolution as we see them now are colored blue-purple and those that appear as they were shortly after they organized are deep red, then the distribution of colored dots will be like that of the visible spectrum with the colors progressing from blue-purple, blue, green, yellow, orange, red and deep red from center outward. (Note: the same pattern applies to the changes in recessional velocities and redshifts [see next page] with the slower velocities and smaller redshifts [arbitrarily assigned blue colors] being close-in to the center while those with progressively faster velocities and larger redshifts increasing systematically outwards through green, orange, and red.) This spherical color distribution, following the spectral sequence, thus envisions relative ages or stages of development based on proximities and light travel times that vary systematically outward but the distribution implicitly is still bound by an absolute age relationship in which the majority of galaxies are considered to be of one general and narrow age since inception.
Intuitively, one might imagine while looking outward and back in time that the farther out we see, the older are the galaxies. But as shown above, this is just in fact just the opposite of distribution of developmental ages. This is one of the insights that Relativity has led us to. Also, intuitively we might (subconsciously) harken back to the belief of the ancients up almost to the 20th Century that the Milky Way in fact lies at the center of the observable Universe. Since we don’t actually know where the outer boundaries of the Universe are (if the geometry described on the next page is selected to be that of a finite Universe; other models lead instead to a boundary-free infinite Universe), we cannot say where we actually lie within the horizons reached by telescopes. We could actually be at (near) the center but this is highly improbable (a quirk of pure chance). More likely, the Milky Way is not equidistant from all the outermost galaxies seen so far, and is not near any center (expansion models do not allow for a discoverable center) - a positional state that may not even be valid (one can however speculate about the spatial distribution of galaxies relative to the singularity which doesn’t have a location since the space associated with this Universe did not exist until after the Big Bang).
We on Earth are likely subject to the Copernican Cosmological Principle which says that there is no preferred location in the space within the Universe we dwell in. Thus, an observer at any galaxy regardless of location will see the same general picture of a Universe with galaxies seemingly moving away as the Universe expands. An astronomer on a planet in a galaxy 7 billion light years from Earth should therefore see the same patterns of movement and age relationships in a Universe that likewise appears homogeneous and isotropic (General Cosmological Principle) that we have deduced from our vantage point.
Because the above ideas may seem bizarre and perhaps contradictory, we will reiterate for emphasis their essence in this (seemingly repitious) statement: Galaxies detected by the HST as farthest away, say 10-13 billion light years, will look to us like they are among the youngest in the Universe. What we see of these distant objects is their status or appearance at that time, when they were young; we can make no claim as to their condition today, except that it is reasonable and probable that they would, if we could somehow transport ourselves to their neighborhood, resemble those we do see close by today. As the distance between Earth and the galaxies we choose to observe becomes progressively less, in terms of light years, we see them as ever further along in their evolutionary history (assuming that the vast majority of galaxies formed during the first several billion years since the Big Bang).
From the grand concepts of Relativity (perhaps the greatest “thought” of the 20th Century), it is concluded that space itself is the entity that is doing the expanding rather than just the matter within it simply flying apart. As expansion proceeds, the light traveling from one galaxy to another distant one is “stretched” out (thus assuming longer wavelengths, as described by redshift process [next page]). Thus, both evermore new space and the matter it will contain can be said to be “created” and organized from the events ordained by the Big Bang. The expansion of space is four-dimensional (3 spatial and one time dimension); this is often referred to as spacetime (the first illustration in this Section, on page 20-1, is a spacetime diagram). Since the Big Bang, as time increases after the singularity-activated, ever-larger regions of the Universe become progressively visible.
It is important to note that, while space is the entity doing the expansion, there is no corresponding expansion within galaxies (their stars are not drawing apart, and in fact over time they tend to contract as the stars move inward towards the usual Black Holes at their centers). A major reason why galaxies (and our own Solar System) do not seem to participate in the general expansion, which applies primarily to the large-scale Universe, is the effect of “local” gravity (from the stars within a galaxy, plus some contribution from nearby galaxies in clusters) that roughly counterbalances the enlargement of space.
It is difficult to draw upon ordinary visual experience to envision this expansion but the analogies described in the next two paragraphs can be useful.
A simple way to visualize that idea is to carry out this rubber band experiment: Take a wide rubber band and penmark five marks on it - one [make it an X] at the center as a reference, then one dot on either side an inch apart and one more dot on each side separated by another inch from each of the inner paired dots; holding the band around your two forefingers, gradually stretch the rubber band outwards about three inches and observe the shifts of the dots against a backdrop of a ruler, placing and holding the center X at some number; the two inner dots move some distance and the two outer dots also move but over a greater distance; also, the increase in separation between inner and outer dot on either side is larger than between the X and inner dot; since velocity (v) = distance (d) divided by time (t) and the time of the stretch was the same for all dots, the outer dots are said to move apart at a greater velocity than the inner pair; this is a relative effect since any set of points along the rubber band do not actually move at different speeds as it pulls apart. This manner of motion is inherent to cosmological expansion; otherwise, if all points expanded at the same velocity along radii of a sphere from a common starting point, all would simply migrate outward as an expanding shell creating an increasing void bounded by their inner edge (here, the balloon analogy may help to picture this).
To help picture in one’s mind the more abstract 4-dimensional (time included) expansion of the Universe, the example is often cited of the spreading apart of polka dots on a balloon’s surface that is progressively enlarged as the balloon is inflated. This analogy is a good working description of one mode of the enlargement of space (spherical) if one simply ignores the everyday experience of a balloon having an interior - instead think only in terms of its surface; the analogy is not meant to imply that the Universe coincides with an expanding surface of a sphere within which there is nothing (but air or gas in a real world balloon). A spherical surface has the special property of being dimensionally finite but has no edge as such; it curves continuously on and through itself. In the balloon example, its surface is in effect a 2-D curved surface. The balloon’s surface can be thought of as representing the surface of an expanding sphere on which the Universe’s components - galaxies, intergalactic matter, “empty” space between stars and between galaxies, radiation - are located. The universal space being generated associates with the equivalent balloon surface (however, the galaxies, unlike the dots, do have dimensional depth). The advantage of the balloon example is that it helps us, as 3-D dwellers who have problems in picturing an expanding space with Einsteinian curved dimensionality, to picture the separation of points on a finite, curved, closed space geometry, by working on the 2-D analog that illustrates some of the properties of cosmic expansion. (A word of caution: other expansion geometries - hyperbolic and flat - are possible and lead to different end results, as discussed on the next page.)
For the Universe, any point on the sphere is equivalent to any other point but the idea of a center on the sphere itself has no meaning. Only when one point (such as Earth) is chosen as an observing reference does any meaningful framework of spacetime geometry have any value in discussing “location”. Earth, in Babylonian and Ptolemaic models, and in those adopted by Christian theology, was once held to be the center of the Universe. Later, the Sun was accepted as center. Now it has become obvious that our solar system occupies a non-important position part way out from the central region of our Milky Way galaxy. This galaxy is as typical (“normal”) as most others in the Universe. Its location within the Universe cannot be specified with respect to an ultimate center, since none can be found. (Thus, some civilization on a planet around a star in a distant galaxy could likewise elect to place themselves as apparently at the center of their perceived Universe). But, again, no real center can be fixed anywhere since all points on the expanding geometry (see next page for the spatial alternatives, which include non-spherical and contracting models) have equal weight and significance. In a sense, the fourth dimension has a “center”, namely the singular point in time when expansion began.
Some people have difficulty in visualizing these movements of collected matter, e.g., the galaxies, in an expanding space. The balloon analogy mentioned above helps but has two flaws: 1) it is two-dimensional, with the balloon interior being empty of objects (ignoring the air), whereas in an expanding Universe the enlarging space has embedded matter such as galaxies and stars, and 2) as the rubber is stretched, small objects painted on for reference, such as dots larger than points, will also enlarge, whereas in the Universe, the galaxies remain the same in size while the intervening space has done the enlarging.
Another commonly cited “mental picture” is the raisin loaf analog. Consider bread dough(with a high dosage of yeast) in which are embedded randomly but uniformly spread out numerous raisins. The dough (envision this either in the traditional shape or as a sphere) is then baked in an oven. As it cooks, the entire loaf expands outward indefinitely (in reality this process will eventually stop). With growth, the raisins become progressively farther apart but the individual raisins largely retain their original size. During expansion the raisins farthest from any one chosen as a frame of reference will move the most and hence at a faster clip (velocity) than those close to each other. While helpful in the visualization, this model too has problems. The raisins near or at the edges do not see raisins in all directions, only inward, which violates the Cosmological Principle. And, as one stands back from the baking loaf, the bread “universe” has a conceptual center. So then, this analog is imperfect and aids only in envisioning a part of the expansion picture.
Let’s delve into a pictorial way to visualize this notion of expansion with the help of this diagram which presents the process as a 2-D portrayal using circles (the concept depicted works just as well for the 3-D [balloon] version):
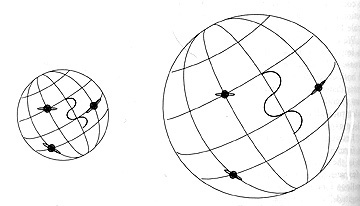
From J. Hawley and K. Holcomb, Foundations of Modern Cosmology, © 1998. Reprinted by permission of Oxford University Press, Oxford, Great Britain.
The circle on the left depicts a sphere with a radius r1 on which a coordinate system (essentially, latitude and longitude lines) has been traced. That describes expansion from an initial point (radius r0). As expansion continues, the circle on the right now has a radius r2. The coordinate system has correspondingly expanded so that the coordinates of any point, such as locate any of the three “Saturn” discs (note that they remain constant in size even as they separate; this is analogous to the above-mentioned statement that galaxies do not expand in proportion to space expansion), have changed only in scale. From this one can define a basic function called the Scale Factor, given by the symbol R, which describes the changes in dimensions (three-dimensional lengths) in an expanding system as a function of time. This simple equation applies: R(t) = r:sub:`n`/r:sub:`0`, where rn is the radius at some specific time and r0 is the initial radius (for the Universe, the singularity point). Thus, the amount or rate of expansion (or contraction) can be adjusted by a given Scale Factor; if not defining a linear function one value will yield a faster (slower) rate than another that is numerically less (greater). For a given span of time, separations (length spreads) will be greater for higher R’s than lower ones. The coordinates are said to be co-moving, that is, they enlarge during expansion but all x, y, and z points referenced to them scale proportionately with R while maintaining their same relative positions. The Scale Factor is a fundamental geometric property that is relevant to a description of an expanding Universe.
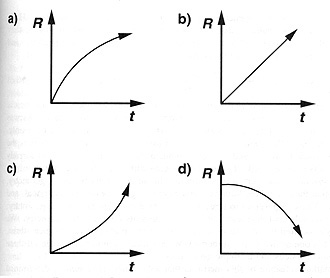
From J. Hawley and K. Holcomb, Foundations of Modern Cosmology, © 1998. Reprinted by permission of Oxford University Press, Oxford, Great Britain.
Graph a shows a decreasing rate of expansion, b a uniform or constant (linear) rate, c, an increasing rate, and d a negative rate of expansion (i.e., a contraction).
Note that for a given increase in expansion over some time from t1 to t2, points that are farther apart at t1 expand at progressively greater velocities than those nearer each other; thus, they cover greater distances in a unit of time (we shall see on the next page that this ever increasing velocity outward is associated with progressive increases in wavelengths of light as shown by the redshift phenomenon).
This can be further elucidated with this diagram:
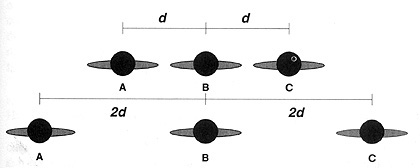
From J. Hawley and K. Holcomb, Foundations of Modern Cosmology, © 1998. Reprinted by permission of Oxford University Press, Oxford, Great Britain.
Let the upper row represent the position of three galaxies at t1 and the lower the later expanded location at t2. The elapsed time is (t:sub:2 - t1) = Δt (Delta t = a finite interval of time). Initially, each galaxy is separated by a distance d. Following expansion, A is now separated from B by 2d and from C by 4d. Therefore B has moved with respect to A (the observation position) at a recessional velocity (d/t) of (2d - d)/Δt = d/Δt and C from A at (4d - 2d)/Δ t = 2d/Δ t. Thus, the velocity of recession of C with respect to A is twice that of B to A. (Returning to the balloon analogy, one can see that farther dots recede faster than closer ones relative to some dot chosen as the point of observation.) The relative velocities will depend on the Scale Factor. As determined from red shift studies (next page), in this dynamic Universe any two galaxies are moving relative to one another at different recessional velocities which depends on their distance apart; the velocity between one of these galaxies and still a third that is twice as far away will be double (twice) that of the first pair considered.
We can gain an even better insight into several of the ideas expressed on this page by drawing upon another analogy. This is quoted directly from Joseph Silk’s The Big Bang, 1989 (comments in parentheses are the writer’s [NMS]):
” We can try to visualize the initial expansion (of the Universe) by imagining an immense swarm of bees (matter; later, the galaxies) crammed into a tiny hive. Suddenly the beekeeper removes the hive, and the bees rush off in all directions (at once). Any given bee will observe its neighbors to be moving away from each other. Suppose all the bees fly in straight lines but in random directions. The swarm of bees will steadily spread out, covering an ever-increasing volume, and the fastest bees will be farthest away. A simple relation connects the velocity of any bee with the distance traveled.”. To this I add: there always remain some bees close-in to the hive site; and some bees don’t get too adventurous and start flying at greater speeds past other bees further out, i.e., they elect to stay in their relative positions after release. And, like the bees, within galaxy clusters, the net motion of individual galaxies tend to be in all directions (i.e., random) including some coming towards Earth even as the cluster groups themselves are moving both outward and apart.
Let us turn our attention to what has been learned in the last decade about the outer reaches of the observable Universe. This next illustration is a panorama of galaxies imaged by HST in which some of the light points are located in what has been called the Deep Field region, i.e., in that region of space with galaxies that are the farthest from us, in terms of light-year travel distances.
The apparent 2-D aspect (i.e., flat; lack of depth) of this image is misleading in that many of the galactic bodies (stars cannot be resolved) - generally, the ones appearing to be larger, with discernible structure - can be shown to be relatively close. Size, then, is mostly a function of distance although galaxies do vary in dimensions to some extent. Most of the smaller ones may be 6 to 9 billion light years or more away. Those objects farthest way - near the edge of the (so-far) observed Universe - appear as tiny blue specks (about 1,000,000,000 times fainter than can be detected by the human eye); their red shifts (see next page) of greater than 3-4 indicate them to be the fastest moving in the expanding Universe as predicted from the Big Bang model.
A few of these extremely distant objects may well be galaxies that formed in the first billion years. An example below (which also illustrates how the Hubble scientists go about the process of making their observations and drawing their deductions) shows a small region of the Deep Field (and several closer galaxies) as imaged by HST in four spectral bands from the UV to the Near-IR.
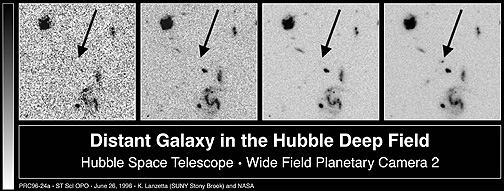
The arrows point to a location within this region in which no object appears in the left three panels (UV and two visible bands) but a dark spot under the arrow in the right panel (Near-IR) shows an object (presumably a galaxy) in that position. Its red shift (see next page), now out of the visible red into the near infrared, is great enough (> 5) to fit an object near the time-space edge of the Universe corresponding to the earliest period of galaxy formation. Thus, detection of very distant galactic objects is very much dependent on wavelengths sampled.
The more distant galactic objects detected so far (by the Hubble Space Telescope [HST]) are at least 7 billion light years, and some perhaps 10-13 or more billion l.y., away from us. HST has now found galaxies whose redshift distance calculates out as 12 billion l.y.(and one at 13 b.l.y.); these are so faint that the view seen here represents an exposure time of 36 hours as the NICMOS (Near Infrared and Multi-Object Spectrometer) instrument gathered radiation from a very narrow field of view pointed near the top of the Big Dipper.

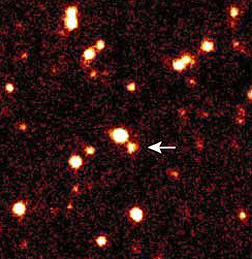
In October, 2001, a sighting of what then is the farthest galaxy to be detected was reported. Look at this image, made using the HST in conjunction with the Keck Telescope:
The larger field shows the galactic cluster Abell 2218 which lies a distance of about 2 billion light years from Earth. The small square in this image is enlarged and inset in the upper right. Within it, arrows point to (apparently) two red spots. These are actually a single small galaxy at a distance from Earth calculated to be 13.4 billion l.y. (in this case, the Hubble constant that gives a Universe age of 14 billion years was used). Thus, the galaxy has presumably formed within the first billion years of Universe time since the Big Bang and is visible only because of the emergence of radiation after the “Dark Ages” of the early Universe (see page 20-1). The reason for the double red dots is another case of the effect of image splitting owing to the Einstein’s General Relativity mechanism of optical bending of light as a result of gravitational influence of mass, concentrated in galaxies and stars (see Preface to this Section). This Einstein mechanism is thus responsible for the gravitational lens effect exerted largely by the Abell cluster, which magnifies this small (500 light years across), still growing (in its infant stage) galaxy that gives us an insight into the appearance of the first galaxies.
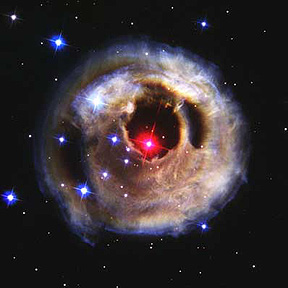
That distance record may have since been supplanted by a new value of 14 billion light years. Japanese astronomers, using the powerful Subaru telescope, made multiple exposures of the objects in a small segment of the celestial sphere. They added (superimposed) the luminosity measurements from these repeat observations so as to get a brighter image. Thus:
The notable brightness and irregular shape of this galaxy are attributed to an hypothesized large number of young giant stars undergoing explosions (most likely, supernovae), with its luminosity possibly added to by rapidly forming quasars. It is conceivable that this galaxy (and presumably others) is actually undergoing destructive disruption and may have since disappeared.
What is beyond the current observed limit to the Universe is still unknown but should someday be determined by better radiation-gathering instruments. It is worth mentioning at this point three attributes of the status of the farthest out galaxies deep-space imagery, already alluded to: 1) during the 13-14 billion l.y. transit time, both the Earth (receiving end of signal) and the galaxies (source or sender) have been receding from each other; 2) since the best estimate of time zero at the Big Bang is currently being stated as 13+ billion years, it follows that the outer limit (if such exists for a finite Universe) is still beyond the reach of our observation capabilities, and 3) the galaxies seen here are in the stage of development as they were 12-13 billion years ago and today have evolved through that time span to states we can only conjecture about.
As the galaxies began to form and afterwards evolve - producing visible entities whose relative motions with respect to one another can then be monitored - they all continued the earlier expansion motions imposed since the Big Bang. This, in effect, means that they are all moving generally in the direction of expansion while at the same time are each moving apart from its neighbors (thus, all galaxies tend to spread apart from one another, although they occasionally can cross paths and collide). In any (and all) region(s) of the Universe, such as the Local Group which contains our Milky Way and many nearby galaxies, the movements of these galaxies, while expansive overall, tend to be in various directions including towards one another (thus ensuring some collisions), but with the majority outwards. A few, such as Andromeda, are currently moving towards us. And whenever galaxies that form a group or cluster are examined, some proportion of the total will show shifts towards the blue (not necessarily into the blue). This multi-directional motion pattern results from gravitational interactions that mutually perturb their relative movements (see the bee analogy below). This is observable only nearby; at great distances the larger red shifts swamp any variation caused by more immediate conditions around the observed galaxy(ies).
To sum up, General Relativity demands some degree of curvature for expanding space. This is controlled by the balance of gravity against the forces imposed by the initial Big Bang. The distribution of matter determines the geometry of space. Space in some way will curve back on itself, maintaining the requirement that it has no (edge) boundaries. If space completely curves back on itself, the Universe is closed; if curved in other ways, it is open. We can only see that part of the (visible) Universe in which light has had time to get to our observing station. In any mode obeying General Relativity that recognizes perpetual expansion, the Universe will be infinitely large; this means that it will grow continuously forever. As time from the present moves onward, we will see further beyond the present horizon; thus in another billion years, the Universe will be at least that much larger by the amount of expansion that has taken place in this interval and the most distant galaxies will then be a billion light years further “out” than in relation to their positions today. But, one must remember this effect: Any two galaxies moving generally in the same outward direction during that billion years are both in forward motion but since the motions are relative, what has changed is their new separation a billion years hence. And, keep in mind that there is no actual center in the expanding distribution of objects in space; from our observation location, however, we seem to be at a “center” in that all galaxies appear to be receding from us (the exception: a few galaxies - which are indeed moving along with the expansion - will appear as though moving in our direction (like a bee that temporarily turns inward toward the hive point).