Novae, Supernovae; Neutron Stars and Pulsars; Quasars and Black Holes; Gamma Ray Bursts; and Star Collisions.
Contents

Novae, Supernovae; Neutron Stars and Pulsars; Quasars and Black Holes; Gamma Ray Bursts; and Star Collisions.
Novae and Supernovae
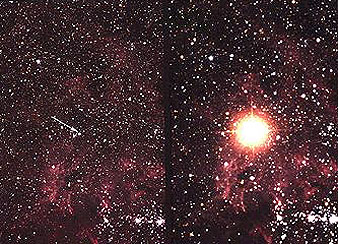
Periodically, a bright object appears in a galaxy and remains that way for days to months It is referred to, erroneously, as a new star or nova (Latin for “new”; plural, novae). It is, in fact, a star that for more than one reason experiences a major flare-up that later dies down leaving the star intact but with loss of material. Star V838 in the Monoceras constellation underwent such a flare-up of a blue star, releasing considerable material as it reached a luminosity of ~600000 times that of the Sun.
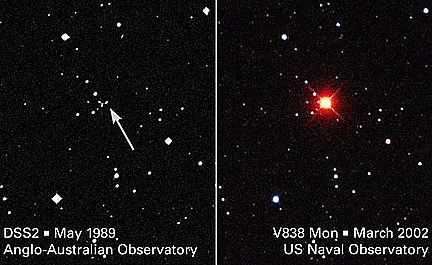
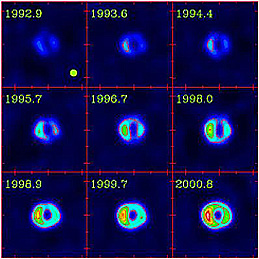
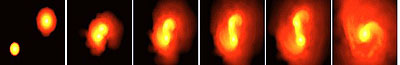
Soon after its discovery, this nova has been examined in close detail by the HST, yielding this dramatic sequence of images:
|Sequential images, made by the HST, of clouds of dust and gas moving outward from the V838 nova. |
Recently, a new hypothesis about its effects on possible planets orbiting it contends that the flare-up consumed these planets. There is, of course, no direct evidence that there were any planets around this star. But the spectra obtained for the nova phase of V838 show a strong enrichment in Li, Al, Mg and other elements that could have been concentrated in planetary bodies that were caught up in and destroyed by the expanding shell of gases in the flare-up. This is the predicted fate for most planetary systems as the parent star expands its gaseous envelope. Our Solar System will likely be destroyed by such a process in about 5 billion years hence (see page 20-11).
Novae are common events in individual galaxies. One way in which these occur is as follows: What in fact is being observed is a binary star system, one member of which is a White Dwarf and the other a Red Dwarf or even a more massive (perhaps Main Sequence) star. The process involves stripping off of hydrogen from the larger companion star which streams toward and is added to the white dwarf, whose gravity controls the activity. This artist’s concept illustrates what happens (in reality, the material being removed should not be luminous which is why the actual process is not observed around such star pairs):
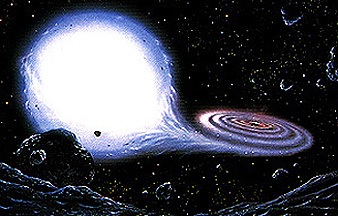
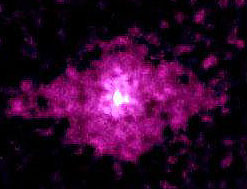
This accretion process causes a buildup of hydrogen gas around the White Dwarf until compression under the strong gravity raises the temperature to 107 °K, at which condition nuclear fusion occurs. This causes a sudden brightness of the White Dwarf and a rapid consumption of the accreted hydrogen some of which also may be expelled. The process repeats through a number of cycles, at time scales of 1000s to 10000s of years per flare-up. Novae are therefore recurring events, without star destruction at each occurrence, in distinction to the supernovae described below. The illustration below shows a nova near its peak brightness; the specks around it are ejected hydrogen (the star near the bottom may [?] be the source of the accreted material):

This star, normally a small ordinary type in the Milky Way about 20000 light years from Earth, is an eruptive variable in which the hydrogen-burning undergoes a significant flare-up, enlarging the star somewhat but not directly shredding off or expelling significant mass. At its peak, the star had about 600,000 times the energy output as the Sun but in time settled back to its prior state. What is observed above in the sequence left-right top-bottom is the outward driving of dust clouds made luminescent by the energy release.
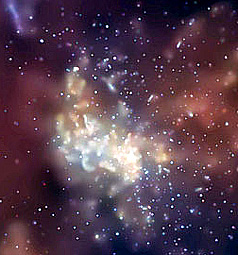
More massive stars, originally with 8 to 50+ solar masses, burn their gaseous fuel (in the plasma state [atoms are ionized]) much more rapidly until nuclear processes force the gases away at high velocities from the core in an explosion whose early stage may be seen from Earth for a few years as a hugely luminous event called a supernova. One such very bright event was imaged by HST on April 28, 1998 in the spiral galaxy NGC3982; the supernova is the large blue-white object in an arm off the galactic center.
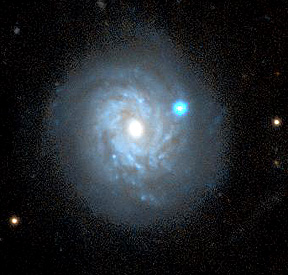
Credit: H. Dahle
Supernovae occur, on average, about once every 30-50 years in a galaxy. (In December, 1997, astronomers observed a localized event in deep space which released more gamma ray energy at that point than has been calculated to emanate from the entire Universe under a normal state. Because of their similarity to the short-lived, bright supernovae, such events have been termed hypernovae, which produce a least several orders of magnitude more energy (10:sup:53 -10:sup:54 ergs) than associated with a supernova (~10:sup:51 ergs), but they seemingly form by different mechanisms.The initial flare-up may take only a few seconds to actuate but the effects can last for weeks to months. Some hypernovae seem related to Gamma Ray bursts, described below.
The rapid rise and decrease of luminosity during a supernova event (labelled “transect”) was captured visually through a telescope looking at GRB 011121 (a gamma-ray-burst source; see below):
In February, 1987 the brightest supernova in nearly 500 years, SN1987A (located in the Large Magellanic Cloud), was discovered in the southern hemisphere skies from an Observatory in Chile. Here is a before-after image made by a telescope at the Anglo-Australian University:
Since 1987, it is being continuously monitored both from Earth and from the HST, providing a “stellar” example of the self-destruction of a star by catastrophic explosion. It appears to still be in a declining luminosity phase going into the 21st Century.
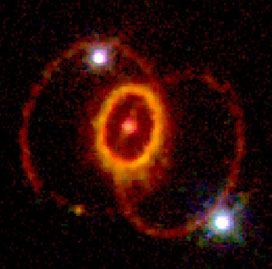
This next image is one of the most spectacular views of 1987A yet acquired by the HST. The single large bright light is a star beyond the supernova environs. Around the central supernova is a single ring but associated with the expansion of expelled gases are also a pair of rings further away that stand out when imaged at a wavelength that screens out much of this bright light.
Visual changes within the star and its surroundings have since been observed in just a decade; thus, here is the inner single ring as imaged 4 years apart:
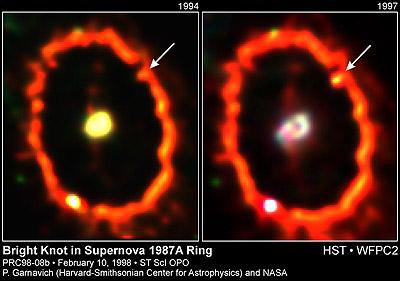
In the left image made by HST in 1994, the blast has pushed out a ring of incandescent gases whose diameter is about 162 million km (100 million miles). The bright central star still appears largely intact. As witnessed again in February 1998, the central star has changed notably, with broad structural variations marking disruption progress. The arrows pointing to an area in the upper right indicated growth of a “hot spot” (yellow) caused by further compression of the gases in the ring. This supernova is also expressive as a concentrated source of x-ray, UV radiation, and radio waves.
The event began about 167,000 years ago, based on distance measurements but its light burst is only now arriving at Earth. As it progressed, the star first cast off an envelope of gases as it expanded to a Red Giant. As its core collapsed, it finally exploded violently in seconds, pushing away exterior gases driven by shock waves, and releasing a huge burst of neutrinos as the core protons and electrons were squeezed into neutrons.
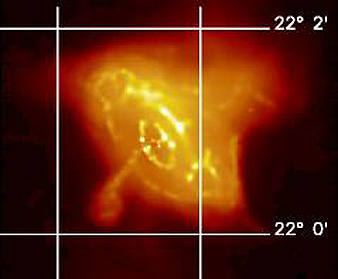
Supernovae in our galaxy and others nearby can appear as very bright light sources sometimes visible to the naked eye. A prime example is this Palomar telescope view of the Crab Nebula (left), with an HST Wide Field Camera view of the volume within the square shown on the right). Below this image pair is an HST image of this Crab Nebula - a marvelous example of the aesthetic nature of many stellar displays.
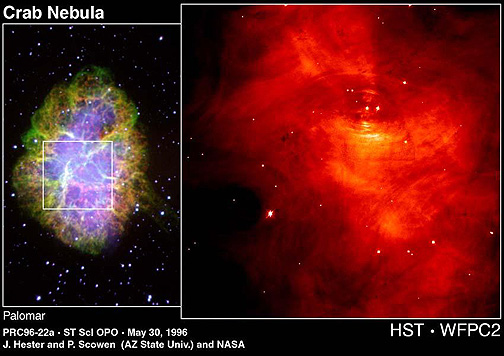

The Crab Nebula is famous in history. It was first observed on July 4, 1054 A.D. by Chinese astronomers as a suddenly appearing bright light, seemingly within the Taurus constellation, remained intense enough so that for a few years it could be seen even during the day. Modern telescope views show that filaments are streaming from the explosion center at speeds up to half that of light. This supernova is, like others in general, an extremely energetic event, radiating from short wavelengths (gamma rays) through the visible and into the long wave radio region. A pulsar-neutron star (see below), rotating 30 times a second, has been detected in its central region. (Recall that the Crab nebula was imaged in four spectral regions, as displayed on page I-3 in the Introduction).
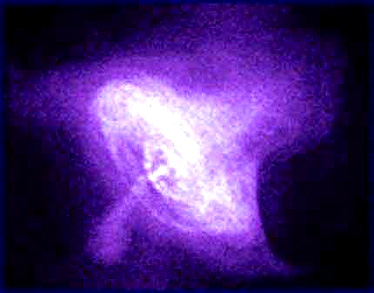
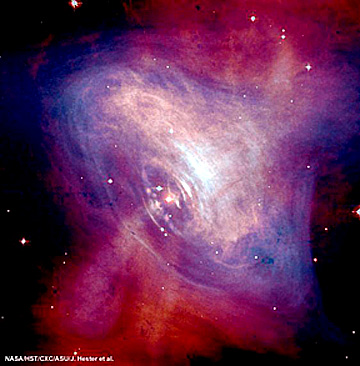
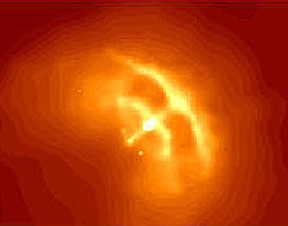
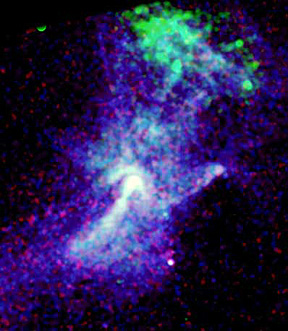
The Crab Nebula has a notably different shape when imaged with x-ray radiation by the Chandra Telescope. We show that below, and beneath it is a striking image made by combining this x-ray image with a visible light image made by the HST. A ring structure emerges and a jetlike protuberance extends roughly perpendicular to the ring.
Recently, the HST returned an image of the Crab nebula that shows (below) the details of the excited gaseous filaments now extending far out into space from the neutron star core. The principal element in many of these filaments is identified by its (process-determined) color: hydrogen = orange; nitrogen = red; sulfur = pink; oxygen = greenish.

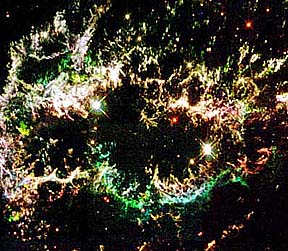
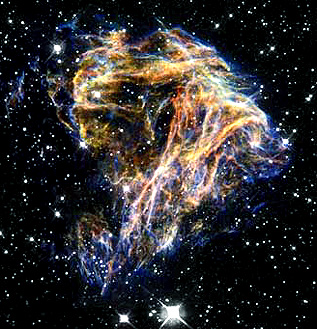
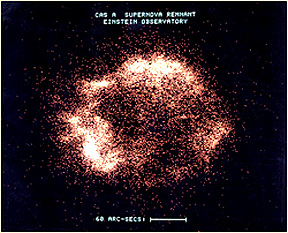
Supernovae are also quite impressive when rendered as images using x-radiation. Witness this Chandra view of Cassiopeia A:
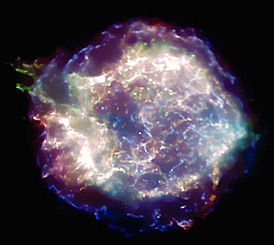
An HST image shows the filamentous structure of the Cassiopeia A supernova. The star that blew up in this constellation was about 10000 light years away. The event took place at that star around 10000 years ago. Historical records note a bright star appearance in the 1600s. In this rendition, oxygen-rich clouds of gas/particles are blue; sulphur is red.
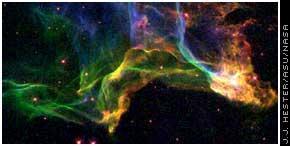
Individual filaments have been examined in detail. Here is part of the Cygnus loop, part of a supernova, seen in visible (top) and in an image produced from gamma radiation:
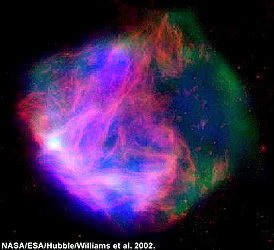
From the preceding images, it should be obvious that supernovae are the “spectacular fireworks show” that delights both astronomers and the public alike when the resulting images are widely displayed. In recent years, astronomers have become quite adept at spotting a supernova soon after it explodes and then training a variety of sensors - both ground- and spaceborne - to preserve the high moments of the event’s expansion. Here is still another “sensation”, SN49 in the Large Magellanic Cloud; the elements associated with particular colors are identified in the caption:
Another supernova example is Eta Carinae, in the 19th Century the second-brightest star in the sky (southern hemisphere) but today is too faint to be seen with the naked eye. Here is a Hubble Space Telescope view of the nebula-like appearance of this exploding star:
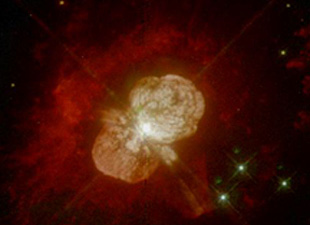
When processed using a combination of red and UV filter images from HST, the central part appears as an apparent “cloud” of matter which is actually mainly a light burst from this supernova, now some 10 billion miles across, that resulted from the explosion of a star 150x more massive than our Sun.

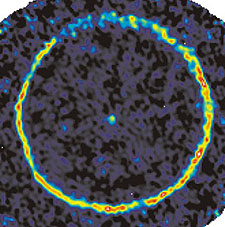
Another Red Giant, TTCygni (in the constellation Cygnus), is a carbon-rich star which as it explodes expels carbon monoxide (CO) in a discrete ring that has now advanced to about 0.25 light years from the central Giant.
Once a supernova is spotted, its rather short history can be monitored in terms of changes in luminosity over time. The graphs below plot brightness variations for several supernovae of recent vintage and for older supernova whose remnants are still visible.

Astronomers have distinguished between two general types of supernovae, separated by the intensity of the luminosity and by the pattern of decreasing light output over time. These are simply labeled: Type I and Type II supernova. The latter has proved particularly useful as another “standard candle” - any class of stellar or galactic objects whose (known) intrinsic luminosity (total power output) remains fairly constant at a specific time in their evolutionary history - in the quest to determine distances to far away stars/galaxies and to relate these to rates of expansion. The two types are shown here in this generalized plot:
|Changes in luminosity with time for the two general types of supernovae. |
A variant of Type I, now referred to as the Ia type supernova, has become center stage in the recent recognition that the Universe is now accelerating rather than slowing down (see page 20-10 where the behavior of this type is considered in detail). Type 1a results when a White Dwarf has grabbed so much matter from a neighboring star (with which it is paired; see top of this page) that it undergoes an implosion followed by a sudden explosion. This event is accompanied by a characteristic spectrum. Type 1a’s are less common than the Types I and II; a 1a occurs on average about once every three years in a galaxy.
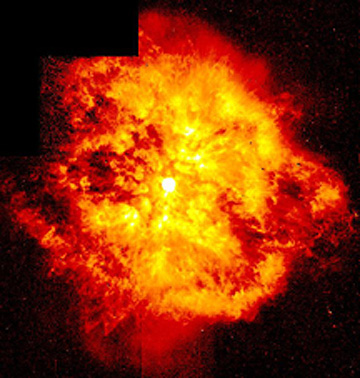
A somewhat different mode of destruction of a massive star involves violent, chaotic expansion of red-glowing (in the visible) gases from a star type known as a Wolf-Rayet star, as shown below, here seen in an early stage of expansion around the still-intact central Giant (about 40-50 solar masses).
A star close to the Sun that explodes as a supernova (or hypernova; see below) can send shock waves and high-speed particles to distances that could envelop the Earth. This is very unlikely at any given time, such as NOW. But, statistically it is finitely possible, and could be one cause of mass extinctions of life on our planet. A group of astronomers have pointed out that a large number of O and B stars occur in a nearby cluster positioned in the sky near the meeting of the Scorpio and Centaurus constellations. Some once in this cluster may have passed through supernovae stages. That Earth may have been affected is implicated by evidence of a deficiency of interstellar matter (including gas) in the so-called “Local Bubble” within which the Sun lies. A consequence of this is that there is less material in our neighborhood that absorbs or impedes light from more distant parts of the Universe; this improves viewing conditions of those cosmic sources. There may be geologic evidence for supernovae material having reached the Earth: marine deposits dated at 2 and 5 million years are enriched in an iron isotope that would be expelled during a supernova explosion.
Neutron Stars and Pulsars
The end product of a supernova event associated with stars greater than about 8-10 solar masses is a Neutron star, with such strong internal pressures that neutrons are formed by intense squeezing together of protons and electrons (remember: p + e —> n); these neutrons are also degenerate. (Degenerate matter describes a condition in which the pressures exerted by the mass [as in a gaseous state] no longer depend on temperature but only on the [high] density reached at this stage; the matter is said to no longer obey the classical laws of physics). During the formation of a neutron star, the prior state star (which may have a core as heavy as iron) develops a degeneration pressure that rises until it is capable of halting further gravity-driven collapse down to a remarkably tiny size.
This class of stars winds up as small objects only a few kilometers wide but containing matter equivalent to 4-5 solar masses. Their densities can exceed 1014 gm/cc (or 107 denser than White Dwarfs). (A feel for this extreme density is gained from this comparison: A volume equivalent to a lump of sugar would contain 100 million metric tons [as measured on Earth] of neutron star matter.) These stars can be detected by telescopes that gather gamma-ray, x-ray, and radio radiation. Obviously, being of such small size neutron stars are very hard to find by optical telescope, even though they can glow with intense radiance, unless they are very near to Earth within the M.W. galaxy. The HST has now provided the first-ever look in visible light, shown below, coming a Neutron star. It is shining just in front of a nebular dust mass whose distance is just 400 light years away. (The light is produced by processes involving photon escape from a surface whose temperature exceeds 10000°K; the surface area is quite small in keeping with the miniscule size of the star.) The size of this object has been estimated to be only 28 km (16.8 miles) making it the smallest intrinsically radiating object beyond our Solar System discovered to date by visual means.

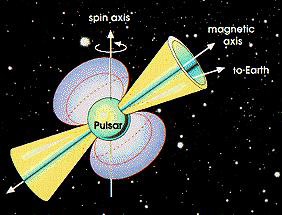
Some Neutron stars, called Pulsars, are known to have intense magnetic fields and to emit directional beams of strong pulses, best observed by radio astronomy but also very evident in the X-ray region, in extremely regular intervals (with periods from about 1/1000th of a second to several seconds) whose cyclical nature is related to their (often rapid) rotation; the Earth must lie within the beam’s solid angle in order to detect this Pulsar action (the pulses therefore are bursts of radiation from a constant beam detected intermittently from Earth, much like a searchlight’s beam, while sweeping continuously, appears to the viewer only when aligned momentarily as it passes through its cycle). This is illustrated by this diagram:
Pulsars are formed by the neutron star’s immense gravity pulling gas from supernova debris, such that this gas is accelerated to a third or more of the speed of light (thus approaching relativistic speeds [those near light speed] and “detonates” when it strikes the neutron star surface. The magnetic field tends to funnel the fast-moving gas and particles onto narrow parts of the neutron star’s surface which become “hot spots. This releases great quantities of energy extending in the spectrum from radio to x-ray regions. There are thousands of bursts of energy that rise from the surface many times each second giving rise to the periodicity detected by radio telescopes and by x-ray observatories such as Chandra.
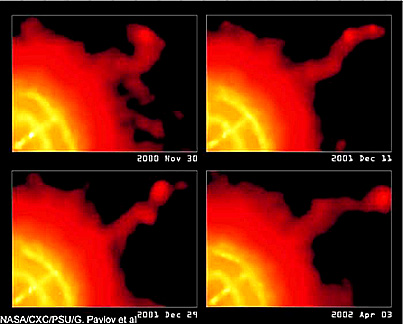
One of the pulsars that has been extensively studied lies in the heart of the Crab Nebula which we have examined earlier. It shows the development of a pair of short jets of very hot gases that radiate strongly in the x-ray region of the spectrum.

This pulsar is shown as a close-up enlargement:
There is a very strong pulsar in the Vega constellation. Here is a Chandra view of this feature, expanded in an inset:

And once again, as seen in more detail.
The jet (about 0.5 light years in length) around the Vega pulsar continually shifts its position and shape, as monitored over many months by Chandra. This bespeaks of a significant variation in the configuration of its driving magnetic field.
Pulsars can be irregular in shape (mainly the result of x-ray excited gas around the central neutron star. This is evident in PSR B1509-38
Here is an X-ray image of the pulsar 3C58 as observed by the Chandra Observatory. It’s initiating supernova event was first observed in 1158 A.D. The neutron star at the center of the pulsar source is rotating at 15 times a second. Its radiation excites the cloud of particles surrounding it.
A rare subclass of neutron stars (only 10 have been found so far) is called a Magnetar, or more formally, an AXP (Anomalous X-ray Pulsar). An AXP has a magnetic field measuring around 1014 and Gauss (the current record holder, at 1015 Gauss, is SGR 1806-20, about 1000 times greater than a typical neutron star and a million billion times that of the Sun’s 5 Gauss. A magnetar is similar to an SGR (Soft Gamma-ray Repeaters), another neutron star variant that undergoes periodic variations in energy output. Both AXPs and SGRs are detected by their pronounced X-ray signals. The Rossi Explorer satellite is used to study neutron stars. One magnetar, N 39, has been imaged by the HST and appears in the visible as a collection of filamentous strands formed from shock waves released when a giant star exploded some thousands of years ago.
Black Holes and Quasars
As seen in the star evolution diagram on page 20-5, when gases and other matter of 50 or greater solar masses gravitationally contract into small, compact bodies, the result is a Black Hole (B.H.), so called because the gravity associated with its extremely dense mass (for the mass in our Sun, collapse into a Black Hole would yield a density of about 1022 grams per cubic meter; larger stars would produce densities several orders of magnitude greater) prevents all detectable radiation from within from escaping beyond its event horizon (sphere of influence). The distance from a B.H.’s center to the horizon is known as the Schwartzchild radius . Since the B.H. is itself invisible (black), its existence must usually be inferred from its gravitational effect on surrounding stars and interstellar matter. Before their observational discovery, Black Holes were predicated to exist from General Relativity considerations. A Black Hole generally is so small that its spacetime expression produces a curvature so pronounced that all internal energy and radiation is seemingly trapped beneath the B.H. (within its horizon).
An exception may be Hawking radiation (named after Stephen Hawking who devised the theory) consisting of particles created by quantum processes and driven by the gravitational energy within and around the Hole. The mechanism by which this process takes place is an excellent example of “quantum weirdness”. In the ‘empty’ space just outside the B.H.’s event horizon, virtual particles and antiparticles are constantly created (as happens in general in this environment throughout the Universe. Under the strong gravity field around the B.H., one of these particles, the one with positive energy, is likely to be propelled away while the other is captured and dragged into the B.H. Antiparticles have negative energy and those brought into the B.H. react with B.H. particles to reduce the mass of the Hole and thereby lower its gravitational field. This B.H. gravitational field, in turn, loses the energy it provided to make the virtual pair. The escaping particles constitute the Hawking radiation, which is too “faint” to be detected from Earth but nevertheless causes the B.H to slowly “evaporate”.
This escaping (emitted) radiation is most effective for tiny Black Holes and provides a means by which they can dissipate over extremely long times through this evaporation. While based on sound theoretical reasoning, Hawking radiation has not yet been directly detected. But if it is proved to exist, it provides a mechanism by which countless numbers of small primordial B.H.’s that formed at the outset of the Universe, because gravity was so intense then, have since vanished. At the present time, astrophysicists are learning more about B.H.’s by computer modeling and simulating their behavior.
Black Holes are also capable of ejecting matter in jets or streams of particles moving in beams almost at the speed of light. (Jets also occur during star formation and during late stages of star death). Here is an HST view of the well-known galaxy, M87, in which its billions of stars are not resolved so as to appear as a yellow glow. The central “star” is actually light emitted from the exterior around a B.H., probably as a quasar (third paragraph below).

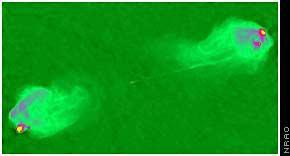
Below are three more views of the jet streamer from M87; the top is imaged by Chandra in the X-ray region; the center is visible light; and the bottom from radio waves. The origin of such streamers, found also associated with other galaxies, is still imperfectly known. But, the Black Hole(s) causing this ejection of gas and particles are the source of strong, directional electromagnetic fields. The gases may be excited by synchrotron radiation, causing the radiation that extends over most of the electromagnetic spectrum.

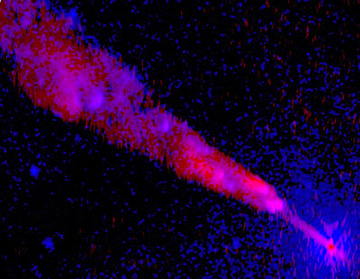
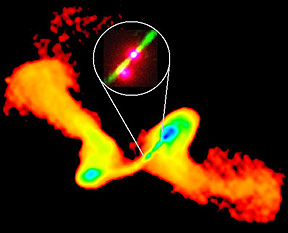
Still another example of a jet associated with the presumed central black hole in a galaxy is Centaurus A (NGC5128) located some 11 million l.y. from Earth. On one side the jet is obvious but it has a faint companion on the other side. This jet pair lines up with the axis of rotation of the galaxy. The image, made by Chandra, is converted to a visible view using data sensed in the x-ray region of the spectrum:

This jet, which follows magnetic lines, is even more splendidly displayed with an HST image is combined with a Chandra image, as shown below, with the strongest x-ray signals shown in blue:
Probably the best image to date of a paired jet associated with a supermassive Black Hole is that recently captured by HST as it trained on Quasar 3C120; the jet, composed of x-rays and electrons, follows strong magnetic lines:

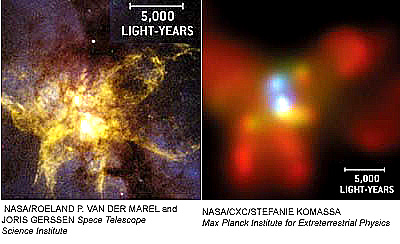
Galaxies are thought to have multiple Black Holes, most of which are relatively small. The first case in which two supermassive B.H.’s occur in the central core of a galaxy has been found in NGC6240. This irregular galaxy is shown in visible light in the left HST image below; the Chandra image on the right indicates a pair of Black Holes, which create a strong x-ray signal (in blue; weaker x-rays in red and yellow) as infalling material is heated to very high temperatures. Astronomers predict that these B.H.’s will eventually merge by collision.
Chandra has now established that the Milky Way galaxy has a moderate-sized Black Hole (located in the celestial hemisphere at a point close to Sagittarius A). The image below shows not the invisible hole itself, but the radiation emitted from excitation of gases and other matter drawn into the B.H. During this continuous exposure over 164 hours, the glowing gases underwent periodic flare-ups that combine in this composite pattern:
In principle, Black Holes should sometimes collide (but the consequences are not yet defined theoretically), especially when two galaxies collide with the B.H’s at their centers then interacting. Evidence for this is sparse. However, such an event is postulated for the observations by the Wide Field Camera on HST of NGC326. In the main view below is the pattern of jet lobes from that galaxy seen a few years ago. In the offset second image is a more recent observation in which the orientation of the principal jets has now shifted more than 90°. The favored explanation is that two Black Holes have now interacted causing the spin axis of one to shift notably.
A Black Hole’s incredible gravity pulls in particles from outside the event horizon until their velocities are accelerated to nearly the speed of light. Matter is literally torn apart upon entering the Black Hole. As these particles close in, monstrous energy releases produce continuous bursts of energy outside the horizon, a process believed responsible for most Quasars (a contractive term for “quasi-stellar” to describe a star-like appearance even though the observed feature is not a single star). Quasars are extremely bright objects (very high luminosity, comparable or even exceeding that of an entire typical galaxy), being perhaps the glow of radiation bursts (“hot spots” of gamma radiation and x-rays) from matter infalling into nuclei of active galaxies (probably supermassive Black Holes). The majority of quasars are located at or near a galaxy center, but some occur in the spiral galaxy arms or in the regions beyond an elliptical galaxy’s core. They were initially discovered as intense radio wave sources detected by radio telescopes. Now it is known that most quasars are not accompanied by radio waves (less than 2% are dominantly radio sources, in which that wavelength region marks energy developed by synchrotron radiation) but are instead sources of more intense, shorter wavelength radiation. Here is an optical image of one (and possibly several) quasar(s) acquired by the HST:

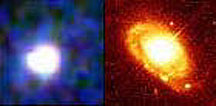
And here is a very bright central core of a Seyfert Galaxy, NGC 3516, with a quasar producing a huge light emission (but probably being “intensified” by gravitational lensing) associated with infall to a massive Black Hole:

A quasar in M1000, as imaged from variations in x-radiation monitored by the Chandra X-ray Observatory, appears thusly:

A quasar with an associated Black Hole seems to be pulling in material from regions beyond. Quasar HE 1013-2136 at a distance of 10 billion l.y., imaged by an ESO telescope on a Chilean mountaintop, seems to be drawing gases from a galaxy to the left:
This pair of images shows a quasar in visible (bright in the blue) and infra-red light.
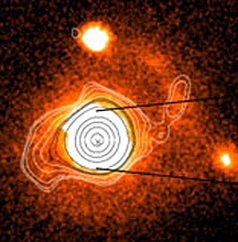
The powerful quasar qso 1 Zw 1, as seen in the infrared, is also a strong radio source (contours superimposed).
Most quasars are so far away (but some more recent ones are nearby) that light arriving at Earth left the quasar source when the young Universe was only about 1/4 to 1/6 its present size. Thus, most (estimates in excess of 75%) quasars formed early in Universe history and many, particularly the larger ones, have since become either greatly diminished (“dormant”, with occasional flare-ups) or are now extinguished in today’s time frame. This generalized (smooth) plot of quasar history, both in terms of time since the Big Bang and when the numbers of galaxies relative to the expansion size of the Universe are normalized to 1 (maximum), illustrates these points:
|Plot of quasar occurrence in cosmic time and at the stages where the number of galaxies per unit volume of expansion are indicated by the ‘relative space density’. |
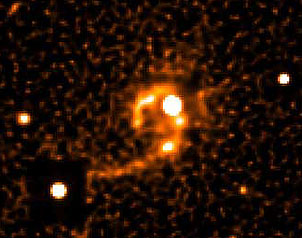
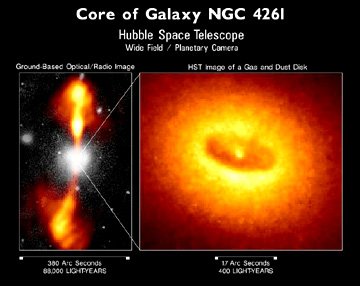
But since Black Holes can still form in young cosmological time throughout the Universe, conceivably they are giving rise (usually after only millions of years) to new quasars. Quasars are made visible because of emission of light resulting from energy conversion as stars and interstellar gases are gravitationally sucked into supermassive Black Holes. HST has observed such events, which may be the case in this image of the elliptical galaxy NGC4261, in which the ring seemingly surrounds such a Black Hole.
Black Holes that occur outside galaxies, or in a star-sparse region within a galaxy, do not attract enough material to become readily visible by virtue of the excitation of incoming matter. But their presence is often suspected where an x-ray or gammma-ray source is observed without a corresponding visible body.
Black Holes can vary in dimensions, the smallest in the general class being much less than a kilometer in diameter but packing mass equivalent to about 3 solar masses. (Theory indicates that mini-Black Holes can be as small as a few centimeters or even microscopic in size.) Humongous B.H.s can contain masses derived from billions of infalling stars and galactic matter, attaining sizes exceeding that of our Solar System. Massive to Supermassive Black Holes may be the customary state at the center of spiral and other galaxy types, having built up from millions stars and other matter converging inward as though moving to a drain. The HST view of NGC7742, a Seyfert type 2 active galaxy, shows a large glowing central region, within which a supermassive Black Hole is postulated. Its bright center probably represents a quiescent quasar state, resulting from energy release when stars spiral past the B.H. horizon into its interior; note the ring of bright hot, largely younger stars beyond and the faint spiral arms further out.

Recently, Black Holes have been detected in Globular Clusters by analyzing the patterns of movement and velocities of stars that can be resolved in the assemblages making up the clusters. These B.H.’s have estimated masses intermediate between the small isolated ones mentioned above and the Supermassive ones described in the previous paragraph. Although the numbers of points in the following plot relating B.H. mass to stellar assemblage mass are still few, a general trend that fits size to a straight line is evident:

In the early years after first postulated and then discovered, Black Holes were treated almost as a curiosity, without any special importance in the initial phases of the Universe’s history. But, with the discovery that most (if not all) galaxies have B.H’s in their core, there is a growing belief among astronomers that they are the necessary starting point in the formation of a galaxy, serving as the nucleus or core that attracts the matter that eventually organizes into a galaxy. Recent reports of both observational and theoretical studies now offer two important ideas: 1) both Black Holes and Neutron stars are more abundant in the inner or central part of a galaxy - a fact related to the idea that massive stars tend to form more readily in the core region; and 2) in early cosmological time Black Holes had a definite symbiotic relation to the processes that form and develop galaxies, i.e., massive B.H.’s can serve either as a nucleus for a growing galaxy or at the least aid in gathering matter into organized gas clumps that evolve into primitive galaxies.
Some Black Holes are thought to be the sole surviving remnants of galaxies that have been completely swept into them. Other Black Holes may have formed during the first seconds of the Big Bang. There are increasing indications that supermassive Black Holes were in existence within the first billion years of the Universe. Many of these are either relics of the B.B. or remnants of early supernovae. In some respects, Black Holes are an approximation to the supersingularity postulated as the starting point of the Big Bang except that they have finite dimensions of meters to several kilometers and even much larger for those in galactic centers depending on their amounts of mass (can be equivalent to the cumulate mass of hundreds of millions to billions of Suns). One theoretical class of Black Holes represent extreme densities concentrated in “points” as small as 10-15 meters.
Speculatively, one future outcome for the Universe (depending on the ultimate mode of expansion [see page 20-8]), after 50 b.y. or so, could be a collection of billions of Black Holes that eventually converge upon themselves to coalesce into a single ultra-dense Black Hole that ultimately would become the singularity for the next Universe (in this model, any number of successive Universes, exploding and contracting cyclically, is feasible). Such a concept of repeating Universes (treated in more detail on page 20-10) is referred to as the “Big Crunch”, or even more colloquially, as the “Bounce” in reference to the repetition of an explosion after total collapse to the B.H. singularity.
Gamma Ray Bursts
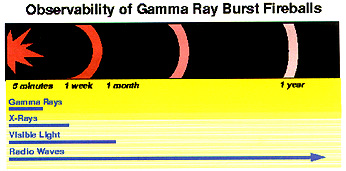
Black holes almost certainly play a role in what are called Gamma Ray Bursts (GRB). These are the most intense and copious releases of energy observed in the Universe - less than that of the Big Bang itself but much more than given out by supernovae or quasars. GRBs can at their outset release enough energy to give them a luminosity calculated to be 1019 greater than that of the Sun. They are characterized by extreme outputs over very brief periods, measured in seconds to minutes at their peak. At least one GRB is observed each day somewhere in the Universe, so they are rather common events, albeit less frequent than supernovae.
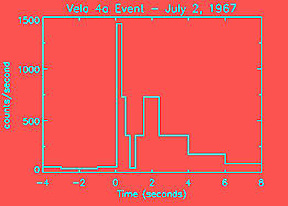
Despite being the largest rapid release high energy events in the Cosmos, GRBs were unknown (sometimes mistaken for ordinary supernovae) before 1967. The manner in which they were discovered is interesting: Nuclear explosions on Earth release large quantities of gamma ray energy. At that time, the U.S. was seeking ways to detect Soviet nuclear tests, so it built and orbited gamma ray detectors on military satellites. The gamma ray events thus found all proved to emanate from well beyond Earth. Here is a plot of one of the first records:
Thus, the diagnostic signature of the GRB that separates it from supernovae is the predominance of high energy gamma rays over very short time periods. GBRs can be subdivided into two types: short burst (around 2 seconds) and long burst (more 2 seconds; initial emissions on the order of 20-30 seconds, with a few extending up to an hour). This time spike has been observed in GRBs detected by more sophisticated sensors that monitored such events. Thus, this example:

These GRBs puzzled astrophysicists. They were first thought to be in the Milky Way. And in fact some were actually located in our galaxy, where they occur on average about once in 10000 years. One such event was observed in the M.W. itself by an X-ray satellite called Beppo-SAX:
But, the frequency of occurrence suggested that the vast majority of GRBs were located in galaxies well beyond the Milky Way. As more observances accumulated, it became evident that GRBs are not concentrated in specific regions of the sky but are distributed at random (isotropic) over the entire sky. GRB’s are also randomly distributed in time - occurring anywhere in the Universe (thus over the full extent of time since the first galaxies;(from thousands of light years to 12+ billion l.y.). A large number seem to be distant, near the outer part of the observed Universe, and hence were most common in the early history of the Universe. Here is a map of the sky showing many of the larger GRBs, as detected by the Compton Gamma Ray Observer and Beppo-SAX.
The CGRO proved very effective in picking up GRBs. The BATSE (Burst and Transient Source Experiment instrument) was particularly suited to detecting GRBs). Here is one image of an event that occurred several billion light years away:

These GRB events should generate radiation at wavelengths longer than those of gamma rays. As studies of them expanded, traces of individual events were sought by other satellites that monitor at different wavelengths. The problem is that evidence of a GRB diminishes rapidly at shorter wavelengths. However, in time such events were picked up at various wavelengths when alerts were given and the sky locations established. Now, with experience this is the time frame for durations of GRBs over a range of wavelengths:
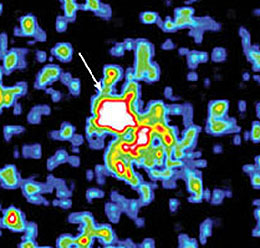
These signs of lower level energy at longer wavelengths persisting around a GRB are grouped under the general term “afterglow”. X-rays proved useful as GRB signatures provided the searching satellite(s) could check out the source region within a few days. The x-ray emissions persist over periods of hours to days. This is one X-ray image of a GRB that was located in a galaxy nearby (some has classified this as a hypernova):
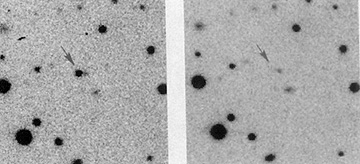
Images acquired by Beppo-Sax were especially helpful in the sky survey for GRBs. The top illustration consists of two intensity contoured images typical of X-ray renditions; note the reduction in intensity in just four days between February 28 and March 3. Below it is a pair of Beppo-SAX images taken first on December 15, showing the GRB as a bright dot and then on December 16 as the afterglow had faded away.
|Beppo-SAX image pair of X-ray signals from a GRB. |
|Images taken a day apart of a GRB, in which x-radiation monitored by Beppo-Sax is rendered like a visible image. |
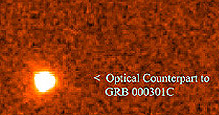
Special attention was given to finding GRBs at visible (optical) wavelengths, since these are capable of measuring red shifts by which approximate distance to the source can be estimated. About half the GRBs give off light in the visible for durations of a week or more. The HST and the Keck Observatory in Hawaii were pointed at targets reported by other observing satellites. Here is the HST image of event GRB000301c.
A ground telescope imaging of another GRB shows the burst as seen in visible light (here the print is a negative) at 21 hours (left) and 8 days (right) after first detection. The rapid fading of the galaxy-sized feature is evident (note arrows)
Although not used a lot for this purpose, radio telescopes have detected and imaged GRBs. Here is one made by the VLA group:
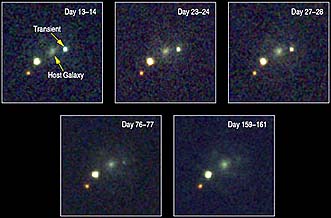
One very important GRB event led to some intriguing information that indicates that this phenomenon occurred early in cosmic time (and continues til the present) and helps to confirm the huge amounts of energy involved. Its magnitude is equivalent to 100 million billion solar radiances. On December 14, 1997 the CGRO registered this event. Word was sent to Beppo-SAX operators and to the HST and Keck telescopes to look for it as rapidly as possible. All succeeded. This is how the event was imaged by the HST:

The image on the right was taken on January 23, 1999 during its maximum. By February 8 (left) this burst (shown at a different scale, in the box) had faded to 1/4 millionth of the visible output.
When a redshift distance measurement was made on the GRB, it was found to be some 12 billion light years from Earth, proving the surmise that GRBs have probably been part of the Universe’s history since soon after the Big Bang. It was also the brightest object yet found at that far distance from Earth.
Thus, the pattern found for most GRB events is rapid emission of gamma rays followed, as they fade, by the dominant radiation passing through x-ray, visible, and radio wavelengths, with the whole sequence being over in less than a few months.
GRBs are of such high interest that another dedicated satellite has been placed in orbit to look for these and similar events. This is HETE, the High Energy Transient Explorer, launched October 9, 2000. It is described at this MIT site. One of its most important discoveries is described four paragraphs down.
The cause(s) of GRBs continues to be uncertain and tantalizing. The early idea of the explosion of material sucked in and around a neutron star (see top illustration on this page for a similar example) has been challenged. But, a variant postulates a role for a binary pair of neutron stars which, if they should collide, produce a huge release of energy. Another hypothesis, known as the Paczynski Model, starts with a supermassive (type O) rotating star that collapses to form a black hole that continues to draw more material around it until a critical state requires an intense explosion producing the GRB fireball. One version indicates that the energy release may be directed, something like the beam associated with a pulsar. Still others attribute the GRBs to some involvement with quasars. One school holds them to be the outcome of giant supernovae (hypernovae) which generate the most powerful short-time energy release levels known in the Universe. A recent hypothesis takes still a new tack - the GRBs are associated with large clusters of galaxies which together have such a strong gravitational pull that they accelerate matter both within and around the galaxies to high speeds that, upon colliding with intergalactic matter, release energy at the gamma-ray level.
Some of the above information has been extracted from an article in the December 2002 edition of Scientific American, entitled “The Brightest Explosions in the Universe”, by N. Gehrels, L Piro, and P. Leonard. The article contains this illustration that summarizes the authors’ ideas on the formation of GRBs:
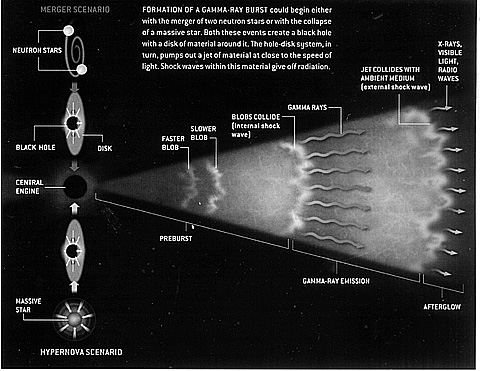
From Scientific American, December 2002
In their model, similar to some others proposed, GRBs are definitely associated explosive processes that will end forming black holes. In one common mechanism, a massive star collapses and explodes as a hypernova, leading to a disk of matter/energy surrounding a black hole; this is a fast process in the sense that at a critical time, the hypernova ensues without anything discernible obviously leading up to it. Alternatively, over a long span of time (millions of years, the same end result occurs as two neutron stars mutually orbiting finally crash into each other. The wedge to the right of the ‘Central Engine’ conforms to a jet that carries the photons released in the GRB outward at near light-speed. This material moves outward as “blobs” that catch-up and coalesce forming internal shock waves that generate the gamma bursts. With expansion over time, the high energy photons are replaced by those of progressively lower energies represented by x-rays, light, and radio waves as the emissions encounter the galactic/intergalactic medium. The final result is an afterglow that fades over time.
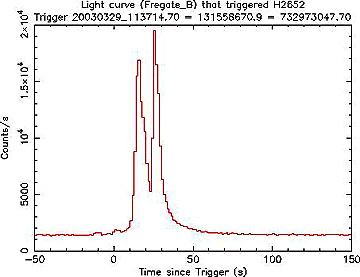
On March 29, 2003, HETE captured a GRB (HETE Burst H2652 is also listed as GRB 030329 and SN2003dh) in a galaxy 2.6 billion light years distant and sent the occurrence of this event back to Earth so quickly that many observatories were alerted quick enough to train their telescopes on it within minutes. Thus, for the first time the earliest stages of a GRB could be monitored. This event proved one of the brightest ever observed. This plot of HETE data shows how brief was the main phase of the event.
A radio telescope image of this GRB taken on April 22 shows a progressive distribution of decreasing energy moving outward. This seems to confirm the “fireball” model for ejection of matter (an alternate explanation, that material is ejected in huge blobs [the “cannonball” model, is apparently not valid for this observation). The expelled material moves at nearly the speed of light.

Spectrographic data showed that the initial burst of H2652 was rich in excited Silicon and Iron. These elements would be produced in a star whose mass is at least 30x that of the Sun, which would give rise to temperatures and pressures that generate nuclear reactions that fuse nuclei into Si and Fe. These are the conditions that favor a “super-supernova”, another way of referring to hypernovae. Astronomers believe this is convincing evidence for that mode of generation of most (perhaps all) GRBs.
Needless to say, GRBs continue to fascinate cosmologists since they represent the largest and fastest explosive events beyond that of the Big Bang itself. As they are better understood, they may reveal the action of physical processes only now being speculated upon, and suggested by particle physics experiments.
Colliding Stars
At least some of the GRBs and X-Ray bursts may stem from collisions of (usually two) stars (check back at the bottom of page 20-3 for the earlier review of galaxy collisions). As recently as the 1970s astronomers considered collisions to be rare stellar events. Although an actual collision has as yet not be observed by HST or other astronomical satellites and ground telescopes, phenomena associated with certain stellar configurations have now been postulated (attributed) to either head-on or glancing encounters between stars.
As we have seen, stars in the arms of spiral galaxies or the fringes of elliptical galaxies are very widely spaced and hence the probability of collision is low. But star distributions in central cores of these two types show much closer spacing (denser). Even higher densities are found in globular clusters, such as 47 Tucanae:

To appreciate the significant increase in density, if one counts the stars that are about 25 light years from our Sun, the number would be about 100 but if the same 25 l.y. volume is set around the center of a globular cluster, that star number rises to an order of about 1,000,000. This crowding means that those stars are very closely packed and hence capable of numerous collisions. Three processes make collisions much more likely: 1) a process called “evaporation”, in which stars approach other and some are then flinged out of the grouping which contracts to such densities as to make collisions inevitable; 2) gravitational focusing, in which approaching stars have their pathways deflected so that two stars now follow a collision course; 3) tidal capture, in which neutron stars or black holes latch onto nearby stars and in time draw these into the high gravity
Theoreticians have developed computer models to simulate pictorially different modes of collision. Shown here is the sequence of change as two Sunlike stars are merged:
The end result of a collision depends on several factors: 1) whether there is a direct hit or a glancing encounter; 2) the relative size (mass) difference between colliding bodies; 3) the terminal speed of each body. The process can be as brief as an hour; or as long as days to years (this rapid time for completion is one reason while such events have yet to be observed in “real time”). Any two of the 7 density types shown near the top of page 20-5 can experience a collision. In some combinations, such as a white dwarf striking a red giant, the end result is two White Dwarfs (one being the incoming member; the other [Red Giant] dispersing and losing so much of its gas by the interaction that only its core remain which quickly evolves into the new White Dwarf, Or, one star remains relatively intact as the second star is incorporated within it.
In this last case, the result is that the now coalesced star pair has gained considerable mass. This means that it now appears to be a bigger star, and since the total mass determines the rate of hydrogen fuel consumption, the new, brighter star would appear as though it will burn its hydrogen mass much faster and thus appears to have a shorter lifetime - hence seems younger. A specific case: if two stars, each with a mass of the Sun (5 billion years old) that has a total burn out time of 10 billion years, collide and form a single star with twice the mass, the now more luminous composite star would have a life expectancy of 800 million years. This seems to be the best explanation of “Blue Straggler” stars - much brighter than the majority of stars in a globular cluster. This is evident in this HST image of NGC 6397:

An excellent summary of collision processes and consequences is offered in the November 2002 edition of Scientific American under the title “When Stars Collide”, by Michael Sharma.