
Visualization of geographic information
Basic concepts
Visualization refers to the formation of an image of something (someone) in the human brain, which is a psychological process that promotes the observation of things and the establishment of concepts. Visualization of scientific computing is to develop computer tools, technologies and systems to convert a large number of abstract data obtained from experiments or numerical calculations into computer graphics images that human vision can directly feel, so that data exploration and analysis can be carried out. The work of converting geo-data into visual graphics is not new to geo-experts. The compilation of topographic mapping by surveyors, the diagrams used by geographers and geologists, cartographers’special topics and comprehensive cartography are all used to express the understanding and understanding of the phenomena and laws of the geographic world. The biggest difference between visualization of scientific computing and the classical routine work is that visualization of scientific computing is a tool, technology and system based on computer development, in the past, visualization expression and analysis in Geosciences were manual or computer-aided (computer-aided mapping), and paper materials were used as the media for the storage and transmission of map information.
Since the visualization of scientific computing was put forward in the late 1980s, it has developed rapidly and become a new subject, its theory and technology have a great impact on the research and practice of the visual expression and analysis of geological information. The International Cartographic Society (ICA) established a new visualization Committee in 1995, and in June 1996, in cooperation with the Computer Graphics Association (ACM SIGGRAPH), started a research project called “Carto-Project”, which purpose is to explore how the techniques and methods of computer graphics can be more effectively applied to cartography and spatial data analysis, and to facilitate the connection and communication between scientific computing visualization and map visualization. Geological experts have discussed the position and role of visualization in geology, they have put forward the concepts of map visualization, geographic visualization, GIS visualization, exploratory cartography, multi-dimensional geographic illustration and virtual geographic environment, which are closely related to visualization from different perspectives, however, they have different understandings, the understanding of their relationship is not clear.
Multidimensional visualization of Geographic Information System (GIS) refers to the use of 2.5, 3-D and 4-D map representation forms to reflect the multi-dimensional characteristics of geographical objects, the 2.5-dimensional form is a bird’s-eye view map representation with hidden parts on the surface, also known as “pseudo-3-D”, for example, it represents the surface of ore deposits and can be expressed as isoline or small plane in irregular triangular network, that is to say, the elevation value on a surface is not an independent variable, and only one elevation value can be used to represent a surface at any given position. The three-dimensional form is a true three-dimensional display, the three-dimensional technology can be divided into a face-based representation and a body-based representation, in which the face representation can easily provide a precise spatial description of the formation and its structure, especially in the construction of complex zones or rock faults, however, these faces only divide the lower part of the ground surface into many areas, and different geological conditions in each area are not easy to describe; the body representation subdivides the whole into a large number of voxels, one of the main advantages of voxels and their variations is the ease of representing the entire three-dimensional distribution of heterogeneous features. Four-dimensional is to add one-dimensional attribute value (usually time dimension) in addition to three-dimensional, GIS time query ability is not yet common, but geographers may want to have all geographical conditions or a certain time period at a certain moment, the average geographical condition is evaluated, and at this time, it is necessary to obtain values at different times. In order to fully meet this need, time data acquisition capabilities should be combined with three-dimensional models, such as analysis and forecasting of floods, earthquakes, storms and landslides.
Multidimensional visualization of geographic information is of great significance in geoscience. It has prominent methodological significance for describing objective reality dynamically, vividly, from multiple perspectives, omni-directionally and multi-faceted, and for virtualization research, reproduction and prediction of geo-phenomena. For example, in geological science, the true three-dimensional reflection of underground ore bodies and veins (such as oil-bearing bodies, water-bearing bodies, metal ore veins, etc.) can help people discover geological phenomena and mineral deposits that are difficult to find by conventional means; in atmospheric science, the occurrence, development and evolution of cyclones, tornadoes and precipitation clouds are expressed in the form of four-dimensional (true three-dimensional plus time dimension); in geography, it is of great scientific value and practical significance to simulate the flow, fluctuation, erosion of river embankment, and underwater condition after the break.
Types of geological visualization
Geological visualization includes map visualization, geographic information system (GIS) visualization and its visualization in the field of professional application. Map visualization and GIS visualization are two basic parts of the theory and technology of geo-visualization. Geoscience multi-dimensional graphics is proposed from the non-visualization point of view. The principle and method of knowledge expression, acquisition and solution of geoscience problems of maps are the advanced development stage of Geoscience visualization. The study of information expression and communication model and geo-visual cognitive decision-making model in map visualization will theoretically promote the further development of geo-multidimensional graphical model. Virtual geographic environment based on virtual reality technology and computer network technology is the last integrated system of geo-visualization, geo-multi-dimensional graphics theory and technology development.
Geoscience visualization is a concept formed by the combination of scientific computing visualization and geoscience. It is about the visual expression and analysis of geological data. The following three concepts in this field are discussed: map visualization, geographic visualization and GIS visualization, and their relationship.
Map visualization
Visualization plays an extremely important role in the development of modern cartography, although there are still some differences in its understanding. Taylor emphasizes map visualization supported by computer technology and believes that visualization includes communication and cognitive analysis. MacEachren emphasizes the application of communication and visualization in cartography, rather than the technical production of maps, and takes visualization and communication as two parallel elements.
In the process of visualization, the boundary between information transmission and cognitive analysis does not need to be clearly delineated. In fact, they have always been integrated and have the characteristics of mutual action. Because of the two characteristics of visualization, namely communication and cognitive analysis, it has an impact on the theory and method of modern cartography. Figure 11-21 illustrates the conceptual framework of map visualization.
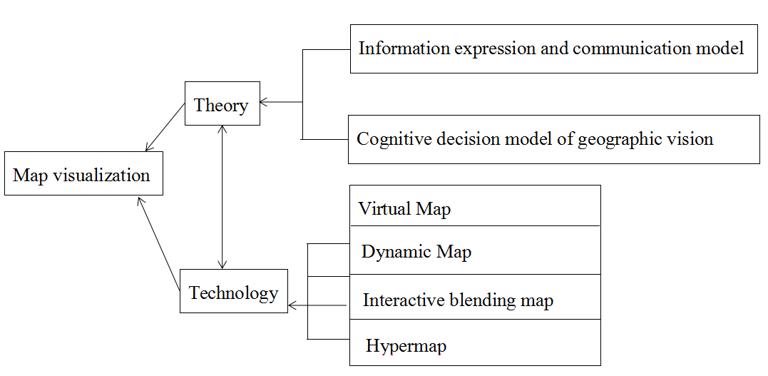
Figure 11-21: Conceptual framework for map visualization
Because visualization has two characteristics of communication and cognitive analysis, information expression and communication model and geographic visual cognitive decision-making model constitute the theory of map visualization. These two models will be applied to virtual map, dynamic map, interactive blending map and hypermap production and application supported by computer technology.
Virtual map refers to a map generated on a computer screen, or two related maps with overlapping degree can be viewed with both eyes to construct a three-dimensional image in the human brain. Virtual maps are temporary and physical maps are static and permanent. The principle and process of the interaction between virtual map and human mental image are different from traditional physical map, and new theories and methods need to be established.
Dynamic maps can dynamically display observations from different angles of geo-data, the results of different methods (such as different colors, symbols, etc.) or the evolution of geo-phenomena over time, etc. because geo-data is stored in computer memory. Because of the dynamic nature of maps, the expression of geo-phenomena unfolds in the time dimension. Therefore, the traditional theories and methods of making symbols and annotations on paper-based static maps are no longer entirely suitable in dynamic situations. In addition, how to recognize and analyze the dynamic information flow needs further discussion and in-depth study.
Interactive blending maps refer to the interaction and information exchange between people and maps. Interactive maps can change the display behavior of maps through certain ways, such as choosing the angle of observation data, modifying display parameters and so on. In this process, screen maps (or binocular stereo maps), or virtual maps, are always in the state of interaction, comparison, mutual modification and feedback with the mental images formed by the relevant geo-knowledge and intuition in the human brain of the applicants. The blending map is the degree of integration between people and maps, that is, people’s sense of engagement and immersion in virtual maps. The difference between the interaction and fusion of maps can be cited as an example. If you go to the library to borrow books, the interaction means that you need to borrow books through the library attendant, first fill in the note, then the attendant goes to look for books, and finally gives it to you. And blending is that you can go directly into the library to search and find the books you want to borrow. Virtual reality technology is the development foundation of interactive blending map.
Hyper-maps is a geography-related multimedia based on the World Wide Web (WWW), which enables users to navigate multimedia data through themes and spaces, which corresponds to the concept of hypertext. Hypermaps raise the question of how to organize spatial data on the World Wide Web and relate it to other hyperdata (such as text, image, sound, animation, etc.). Supermaps play an important role in the wide transmission and use of maps, that is, in public life, social decision-making, scientific research and so on.
Geographic Visualization
Geographic visualization is another concept used in geographic visualization. MacEachren started with map visualization, but he believed that geographic visualization was larger than map visualization. Visualization in remote sensing images, charts, photographic images and so on was not the focus of map visualization. So at present, he tends to adopt geographic visualization, which includes all spatial display tools, and these sets of spatial display are the visualization referred to in modern cartography.
Didase [1990] In view of scientific visualization, data exploration and analysis and the application of geographic science, the framework of geographic visualization is put forward, and the role of map in the process of geographic research is emphasized, which includes data exploration, hypothesis formation and confirmation, synthesis, and final result expression and presentation (Fig. 11-22).
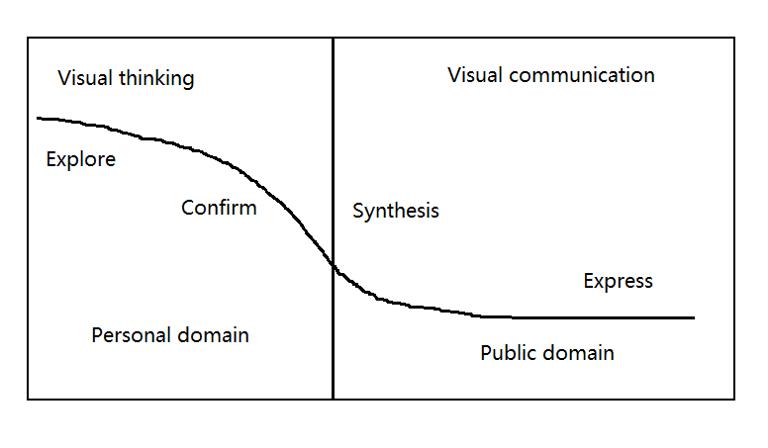
Figure 11-22: Visualization of the framework description as a geographic research tool [Didase]
Didase believes that visualization focuses on the visual thinking of individual characteristics in the early stages of the research process, and on the public communication and transmission of research results in the later stages. This feature will re-establish the relationship between cartography and geography, because in the past two or three decades, cartographers have focused most of their energy on visual communication transmission, while geographers (cartographers) in the 20th century. In the first 50 years, research was focused on visual thinking and visual analysis.
Cartography and geography are two classical disciplines. Their research objects are both regional geographic systems. The former focuses on the map expression and application of geospatial information, while the latter takes map as an important research tool to solve geographical problems. Visualization has the characteristics of visual communication, transmission and visual analysis, which can be used as a bridge to link cartography and geography closely. In harness. Therefore, although geographic visualization can be considered to come from the combination of visualization and geography, and map visualization comes from the combination of visualization and cartography, because visualization has the characteristics of linking and integrating geography and cartography, naturally, map visualization and geographic visualization are two concepts of the same essence, only the division of conventional disciplines and research groups. The difference leads to the emphasis on the understanding of the content and scope of the research. Therefore, the reason why MacEachren adopts geographic visualization instead of map visualization is still based on the classical research features in the field of geography and cartography, rather than on the new technical features of visualization, which reflects the profound impact of the division of disciplines on problem understanding.
GIS visualization
When the computer-based Geographic Information System (GIS) developed in the 1960s began to form, it took the graphical display and analysis of geospatial data as a basic and indispensable function by using computer graphics software and hardware technology. The visualization of GIS was earlier than the visualization of scientific computing. In the early stage of GIS visualization, limited by the development of computer two-dimensional graphics software and hardware display technology, a large number of studies were focused on graphics display algorithms, such as drawing lines, color design, selection of symbol filling, graphics printing and so on. Following the research of two-dimensional visualization, the research of three-dimensional graphics display technology for geographic data surface (e.g. digital elevation model) has been further developed, which projectes three-dimensional spatial data on two-dimensional screen through three-dimensional to two-dimensional coordinate transformation, hidden line, surface elimination, shadow processing, illumination model and so on. Due to the expression of geo-data field is two-dimensional rather than the description of real three-dimensional entity spatial relations, it belongs to 2.5-dimensional visualization. However, the real world is real three-dimensional space, and two-dimensional GIS can not express real three-dimensional data fields such as geological bodies, mines, oceans, atmosphere, etc., therefore, since the end of the 1980s, real three-dimensional GIS and its volume visualization have become a research hotspot of GIS. With the development of global change, regional sustainable development and environmental science, time dimension has been paid more and more attention. With the development of computer science, such as the speed of processing, the capacity of processing and storing data, and the development of database theory, it is possible to process large amounts of data with complex spatial relations dynamically, which makes the research of temporal GIS, spatiotemporal data model, real-time dynamic display and feedback of graphics in the ascendant. Therefore, from the perspective of the development of GIS and its visualization, GIS visualization focuses on the technical level, such as the design of data model (spatial data model, spatio-temporal data model), the display of two-dimensional and three-dimensional graphics, real-time dynamic processing, etc., the goal of GIS visualization is to present the results of geo-processing and analysis with graphics.
Virtual geographic environment
The data exploration of geo-visualization and the realization of geo-multi-dimensional graphics require efficient information exchange between human and geo-data and the graphical scene formed by geo-problems, that is to say, the computer system can provide some information exchange and feedback mechanism, which can enable geo-experts to give full play to their thinking ability and imagination of graphics and images, and enable geo-experts to imagine certain assumptions, and immediately, the results of this hypothesis are obtained. Virtual reality technology can let people completely immerse themselves in a computer three-dimensional scene, and let geoscience experts focus on geological problems, and its fully efficient multi-sensory interaction ability provides the possibility to realize the data exploration of geosciences and the technical realization of multi-dimensional diagrams of geosciences.
Virtual Reality (VR), also known as spiritual realm technology, refers to a special three-dimensional graphics environment created by computer through helmet-mounted three-dimensional display, data gloves, three-dimensional mouse, data suit, stereo headphones and so on, and people can manipulate and control the three-dimensional graphics environment to achieve special purposes. Multi-perception (vision, hearing, touch, motion, etc.), Immersion, Interaction and Autonomy are four important characteristics of virtual reality technology. Autonomy refers to the degree to which objects in virtual environment act according to physical laws, such as objects falling from the desktop to the ground.
Virtual Geographical Environment (VGE) can be generated by combining virtual reality technology, computer network technology and geoscience. Virtual geographic environment is a virtual information geographic world based on geo-analytical models, geo-engineering, etc., it is a virtual information geographic world established by geoscientists to express and describe the spatial distribution and process phenomena of geographic systems according to observation experiments and theoretical assumptions, it is a virtual laboratory about geographic systems, which allows geoscientists to follow their own knowledge, assumptions and intentions to design and modify the geo-spatial relationship model, geo-analysis model, geo-engineering model, and directly observe the results of the interaction, through repeated feedback, and finally obtain the geo-laws.
One of the characteristics of virtual geographic environment is that geoscientists can enter geo-data and feel immersed in it; the other is that geo-experts in different geographic locations can carry out simultaneous cooperative research, exchange and discussion.
Virtual geographic environment is closely related to geographic visualization. The theory and technology of mapping from complex geoscience data, geoscience model, etc. into a three-dimensional graphics environment in a virtual geographic environment requires the support of geoscience visualization; the communication transmission and cognitive analysis of geoscience visualization are easier to implement in a virtual geographical environment with a sense of immersion. Geoscience visualization will be integrated into the virtual geography.
The development and perfection of virtual geographic environment depends not only on the virtual reality technology of computer, but also on the development of geo-information acquisition and processing technology (such as remote sensing, telemetry, etc.), Geo-analysis model construction level, geo-visualization, geo-expert system, geo-spatial cognitive theory and so on. Virtual geographic environment is of great significance to the development of geoscience. The proposition of virtual geography expresses the function and influence of virtual geographic environment on the future development of geography. In addition, it is generally believed that one of the reasons for the slow development of geographic science is the inability to carry out laboratory experiments, which makes the theory of geo-hypothesis unable to be tested by practice. Virtual geographic environment provides geoscientists with the possibility of repeatable information simulation experiments, any geographic analysis model can be simulated and tested by others in virtual geographic environment, thus accelerating the maturity and development of Geoscience theory.
Research framework of geo-visualization
Visualization comes from the visualization of scientific computing, with strong computer technology characteristics. Visualization interacts and merges with traditional cartography, thus expanding the connotation of visualization itself. In addition to the technical characteristics, geo-visualization should also establish its theoretical paradigm. Fig. 11-22 describes the framework of geo-visualization, and the position of map visualization, geo-visualization, GIS visualization, geo-multi-dimensional graphics, virtual geo-environment in the framework, and the relationship between them. Geoscience visualization and science visualization based on computer science overlap and overlap to a great extent, but they can not be substituted for each other, the mutual connection and exchange between the two disciplines will promote the common development of the two disciplines.
Geoscience visualization includes map visualization, geographic information system (GIS) visualization, and their visualization in professional applications such as ocean visualization, atmospheric visualization, geological visualization, and socio-economic visualization. Geoscience visualization can be used to study theory and technology from both map visualization and GIS visualization. The research of map visualization includes the construction of information expression communication model and geo-visual cognitive decision-making model, as well as the design, production and application of virtual maps, dynamic maps, interactive blend maps and super maps under the guidance of the above models. GIS visualization research includes three-dimensional geospatial, space-time multi-dimensional data interpolation and encryption, visual data model design, three-dimensional, multi-dimensional data display and analysis, vector, tensor and uncertain data display and analysis, human and economic data visualization, real-time dynamic interaction processing, parallel technology, geo-visual visualization based on the web and the World Wide Web, multi-user collaborative visualization, etc.
Figure 11-23: Research framework for geoscience visualization
Geological multi-dimensional graphics is a theoretical and methodological model for knowledge representation, acquisition and verification of maps from the perspective of non-visualization, which is closely related to geo-visualization and is a high-level development stage of geo-visualization research. The computer-based geoscience multi-dimensional diagram is based on geoscience visualization, combined with geoscientist knowledge base, inference engine, and efficient human-computer interaction to help geoscience experts gain scientific understanding of a problem. The study of multi-dimensional diagrams of geosciences involves geography and graphic thinking, geospatial cognition, graphical rule acquisition, geoscience knowledge expression and reasoning, and integration with geoscience visualization techniques and systems.
If the high-efficiency human-computer interaction in geoscience visualization and geoscience multi-dimensional diagram is developed into the immersive and multi-sensory interaction mode in virtual reality technology, plus the network connection technology, then the virtual geographic environment (VGE, Virtual Geographic) is generated. Environment). VGE is the final integrated system for the development of geoscience visualization and multi-dimensional diagrams of geosciences, as a computer-based geoscience virtual laboratory, it has very important significance for the development of geosciences. The research content of virtual geographic environment includes GIS data model, real-time dynamic interaction of three-dimensional, time-space multi-dimensional large data volume, network virtual reality modeling language (VRML) and other network development tools such as Java, ActiveX, etc., which are also the digital foundation of earth technology.
