Other Remote Sensing Systems: Meteorological, Oceanographic and Earth System Satellites
Contents
Satellite-and Shuttle-based remote sensors are especially adept at providing image and physical property data regarding atmospheric and ocean surface conditions, usually scanned from meteorological/oceanographic platforms. Example from two of these (GOES and NOAA) are described on this page but the main treatment is reserved for Section 14. Metsats look mainly at cloud cover, water vapor, wind patterns, advancing fronts, and certain atmospheric properties. SeaWiFS is a dedicated oceanographic satellite whose sensor measures in multibands (visible and near IR) that specify ocean color and chlorophyll content (in algae and plankton). To these specialized satellites should now be added a third group - a large array of satellites just launched or to be launched in the next 5 years that gather integrated information on the Earth System - land, marine, atmosphere, and biological aspects of the terrestrial environments. Although not the first directed towards this endeavor, Terra is now operating and returning data that prove the value of this approach.
Other Remote Sensing Systems: Meteorological, Oceanographic and Earth System Satellites
As suggested earlier in this Introduction, among the first satellites in the U.S.’s entry into space were those designed to demonstrate that weather systems and climate variations could be monitored at regional or even continental scales, thus greatly improving the realtime surveillance of clouds, temperature variations, water vapor, and moving fronts (especially tornadic vortices and hurricanes). The Nimbus series has already been mentioned (page I-7), but the images there emphasize land features rather than meteorological conditions. In Section 14, we will review the entire history of the “Meteorology from Space” programs that include satellites operated by several other countries. Suffice here to show two typical examples.
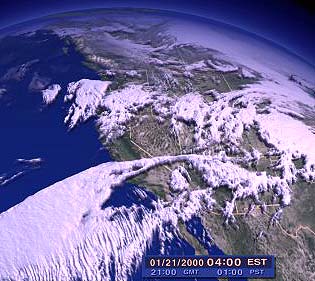
The first is a January 21, 2000 scene covering part of the western U.S. and adjoining Pacific Ocean as imaged many times each day by the GOES 10 (geostationary) satellite. The land tones are darkened so that the cloud patterns, in white to gray tones, stand out.
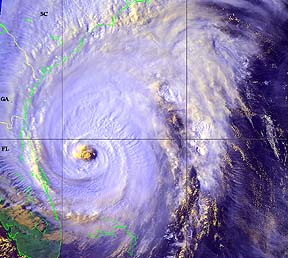
The second scene was made by the NOAA 15 satellite that was the principal monitoring system that followed the westward progress of the powerful Hurricane Floyd which struck the U.S. mainland in mid-September of 1999. This color composite shows Floyd in the early morning of September 15 after it had passed over the northern Bahamas and was bearing down on the north Florida coast. The size of this hurricane can be grasped by noting that the bottom left of the image covers the Everglades (in green) whereas the top left includes all of the Georgia coast into South Carolina.
Many meteorological satellites are adept at picking out chracteristics of the oceans such as silt/sediment patterns, temperatures, wave trains, and current circulation. But several satellites have been flown primarily to sense these and other properties of the ocean surface (again, see Section 14). Among these are Seasat, Radarsat, the Coastal Zone Color Scanner (CZCS) on Nimbus 7, and SeaWiFS (now operating).
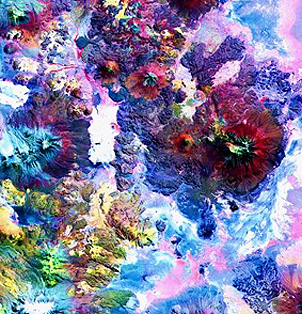
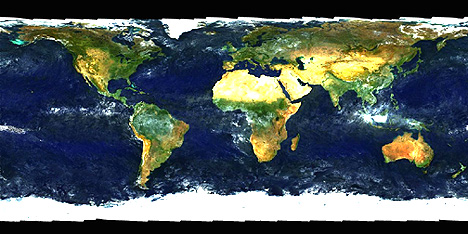
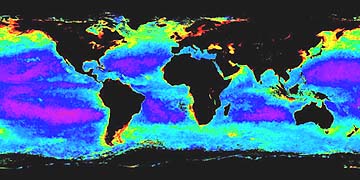
On SeaWiFS, several bands cover the blue, green, and red parts of the visible spectrum, and into the near infrared, yielding data that can be used to display variations in ocean color or, for particular bands, indications of the distribution and intensity of chlorophyll that resides mainly in surficial plankton. This SeaWiFS image maps the generalized ocean colors as well as chlorphyll concentrations (in red, yellow, and orange colors) on a near global scale during September, 1997.
Terra is the “flagship” satellite in the Earth Science Enterprise (ESE) that is the United States contribution to a continuing scientific effort often referred to as the International Geosphere-Biosphere Program. Mentioned at the end of the Overview, the IGBP and its spin-offs are of sufficient scope and merit to deserve its own Section (16) in this Tutorial. The five sensors on Terra are: MODIS, MOPITT, MISR, ASTER, AND CERES. For the moment, we show here just a single image (others will appear in Sections prior to Section 16) made by the ASTER instrument on Terra. This scene is of volcanoes in the Andes mountain chain of South America. Volcanoes are important components of the Earth System being studied by the ESE in that they affect the environment on regional to worldwide scales by expelling into the atmosphere gases and dust that can affect weather patterns.