Electromagnetic Spectrum: Distribution of Radiant Energies
Contents
The specific (named) regions or subdivisions of the electromagnetic spectrum are named and plotted. Mechanisms for generation of electromagnetic radiation are reviewed. The idea of incoming solar radiation or irradiance and its interaction (relative absorption) with the atmosphere is reviewed, and the notion of multispectral remote sensing over different spectral intervals is illustrated with a set of astronomical examples.
Electromagnetic Spectrum: Distribution of Radiant Energies
As noted on the previous page, electromagnetic radiation (EMR) extends over a wide range of energies and wavelengths (frequencies). A narrow range of EMR extending from 0.4 to 0.7 µm, the interval detected by the human eye, is known as the visible region (also referred to as light but physicists often use that term to include radiation beyond the visible). White light contains a mix of all wavelengths in the visible region. It was Sir Isaac Newton who first in 1666 carried out an experiment that showed visible light to be a continuous sequence of wavelengths that represented the different color the eye can see. He passed white light through a glass prism and got this result:
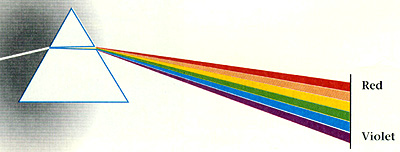
The principle supporting this result is that as radiation passes from one medium to another, it is bent according to a number called the index of refraction. This index is dependent on wavelength, so that the angle of bending varies systematically from red (longer wavelength; lower frequency) to blue (shorter wavelength; higher frequency). The process of separating the constituent colors in white light is known as dispersion. These phenomena apply to radiation of wavelengths outside the visible (e.g., a crystal’s atomic lattice serves as a diffraction device that bends x-rays in different directions).
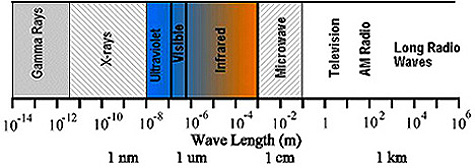
The distribution of the continuum of all radiant energies can be plotted either as a function of wavelength or of frequency in a chart known as the electromagnetic (EM) spectrum. Using spectroscopes and other radiation detection instruments, over the years scientists have arbitrarily divided the EM spectrum into regions or intervals and applied descriptive names to them.The EM spectrum, plotted here in terms of wavelengths, is shown here.
Beneath is a diagram that shows the physical phenomena that give rise to these radiation types and the instruments (sensors) used to detect the radiation. Although the width of this diagram scales closely to the width of the spectrum chart above, difficulty in centering this second diagram, type below type, forces some leftward offset; the narrow pair of vertical lines coincides with the visible range in the upper diagram.
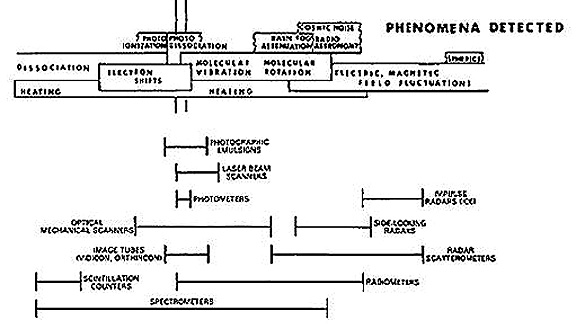
This diagran indicates that electromagnetic radiation, i.e. photon release, is produced in a variety of ways. Most involve actions within the electronic structure of atoms or in movements of atoms within molecular structures (as affected by the type of bonding). The fundamental physics involves changing the direction and/or magnitude of electric and magnetic fields in the source of the EMR in short time intervals. One common mechanism is to excite an atom by heating or by electron bombardment which causes electrons in specific orbital shells to momentarily move to higher energy levels; upon dropping back to the original shell the energy gained is emitted as radiation of discrete wavelengths. At high energies even the atom itself can be dissociated, releasing photons of short wavelengths. And photons themselves, in an irradiation mode, are capable of causing atomic or molecular responses in target materials that generate emitted photons (in the reflected light process, the incoming photons that produce the response are not necessarily the same photons that leave the target).
Different names for length units within intervals (specified by Types) of the EM spectrum, all based on the metric system, have been adopted by physicists as shown in this diagram:

Although it is somewhat redundant, we reproduce here still another plot of the EM Spectrum, with added items that are self-explanatory:
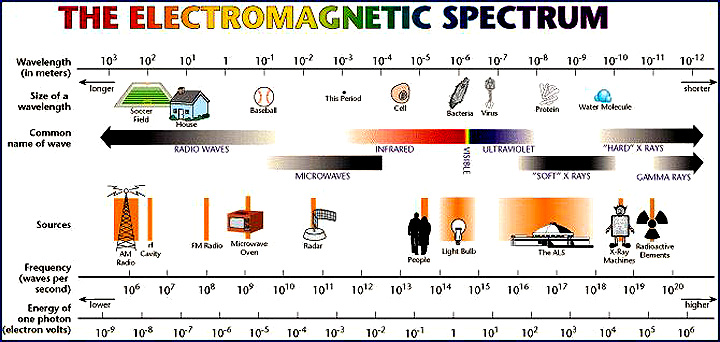
At the very energetic (high frequency and short wavelength) end are gamma rays and x-rays (whose wavelengths are normally measured in angstroms [Å], which in the metric scale are in units of 10-8 cm). Radiation in the ultraviolet extends from about 300 Å to about 4000 Å. It is convenient to measure the mid-regions of the spectrum in one of two units: micrometers (µm), which are multiples of 10-6 m or nanometers (nm), based on 10-9 m. The visible region occupies the range between 0.4 and 0.7 µm, or its equivalents of 4000 to 7000 Å or 400 to 700 NM The infrared region, spanning between 0.7 and 1000 µm (or 1 mm), has four subintervals of special interest: (1) reflected IR (0.7 - 3.0 µm), and (2) its film responsive subset, the photographic IR (0.7 - 0.9 µm); (3) and (4) thermal bands at (3 - 5 µm) and (8 - 14 µm). We measure longer wavelength intervals in units ranging from mm to cm. to meters. The microwave region spreads across 0.1 to 100 cm, which includes all of the interval used by radar systems. These systems generate their own active radiation and direct it towards targets of interest. The lowest frequency-longest wavelength region beyond 100 cm is the radio bands, from VHF (very high frequency) to ELF (extremely low frequency); units applied to this region is often stated as frequencies in units of Hertz (1 Hz = 1 cycle per second; KHz, MHz and GHz are kilo-, mega-, and giga- Hertz respectively). Within any region, a collection of continuous wavelengths can be partioned into discrete intervals called bands.
` <>`__I-8: Given that 1 nanometer (NM) = 10:sup:`-9` m, 1 micrometers = 10:sup:`-6` m and 1 Angstrom (A) = 10:sup:`-10` m, how many nanometers in a micrometer; how many Angstrom units in a micrometer? **ANSWER**
Most remote sensing is conducted above the Earth either within or above the atmosphere. The gases in the atmosphere interact with solar irradiation and with radiation from the Earth’s surface. Although the incoming irradiation is a single source of excitation of atoms and molecules in the air and any materials found at the surface, that EMR irradiation will experience varying degrees of transmission, absorption, emittance, and/or scattering depending on whatever wavelengths are considered. Here is a general diagram showing the “fate” of this irradiation.
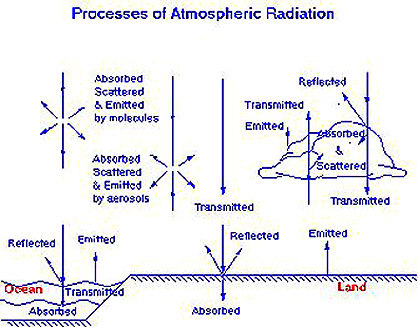
At some wavelengths the irradiation is partly to completely transmitted; at others those photons are variably absorbed by interaction with air molecules. Here is a generalized diagram showing relative atmospheric radiation transmission and absorption at different wavelengths.
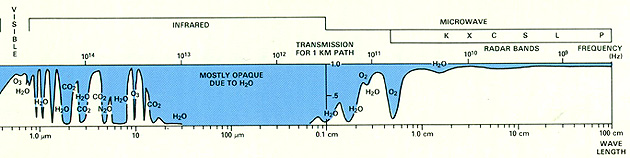
Blue zones mark minimal passage of incoming and/or outgoing radiation, whereas, white areas denote atmospheric windows, in which the radiation doesn’t interact much with air molecules and hence, isn’t absorbed. This next plot, made with the AVIRIS hyperspectral spectrometer (see page page 13-9), gives more a more detailed spectrum, made in the field looking up into the atmosphere, for the interval 0.4 to 2.5 µm (converted in the diagram to 400-2500 nanometers).
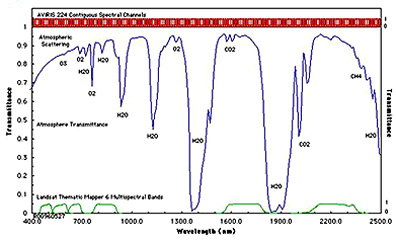
Most remote sensing instruments on air or space platforms operate in one or more of these windows by making their measurements with detectors tuned to specific frequencies (wavelengths) that pass through the atmosphere. However, some sensors, especially those on meteorological satellites, directly measure absorption phenomena, such as those associated with carbon dioxide, CO2 and other gaseous molecules. Note that the atmosphere is nearly opaque to EM radiation in part of the mid-IR and all of the far-IR regions. In the microwave region, by contrast, most of this radiation moves through unimpeded, so radar waves reach the surface (although raindrops cause backscattering that allows it to be detected). Fortunately, absorption and other interactions occur over many of the shorter wavelength regions, so that only a fraction of the incoming radiation reaches the surface; thus harmful cosmic rays and ultraviolet (UV) radiation that could inhibit or destroy certain life forms
` <>`__I-9: ** From the first atmospheric absorption figure, list the four principal windows (by wavelength interval) open to effective remote sensing from above the atmosphere. **ANSWER**
Backscattering (scattering of photons in all directions above the target in the hemisphere that lies on the source side) is a major phenomenon in the atmosphere. Mie scattering refers to reflection and refraction of radiation by atmospheric constituents (e.g., smoke) whose dimensions are of the order of the radiation wavelengths. Rayleigh scattering results from constituents (e.g., molecular gases [O:sub:2, N2 {and other nitrogen compounds}, and CO2], and water vapor) that are much smaller than the radiation wavelengths. Rayleigh scattering increases with decreasing (shorter) wavelengths, causing the preferential scattering of blue light (blue sky effect); however, the red sky tones at sunset and sunrise result from significant absorption of shorter wavelength visible light owing to greater “depth” of the atmospheric path as the Sun is near the horizon. Particles much larger than the irradiation wavelengths give rise to nonselective (wavelength-independent) scattering. Atmospheric backscatter can, under certain conditions, account for 80 to 90% of the radiant flux observed by a spacecraft sensor.
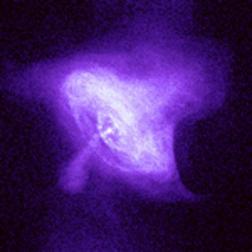
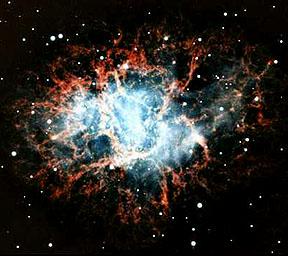
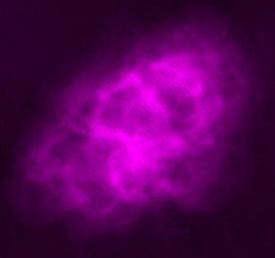
Remote sensing of the Earth traditionally has used reflected energy in the visible and infrared and emitted energy in the thermal infrared and microwave regions to gather radiation that can be analyzed numerically or used to generate images whose variations represent different intensities of photons associated with a range of wavelengths that are received at the sensor. This gathering of a (continuous or discontinuous) range(s) of wavelengths is the essence of what is usually termed multispectral remote sensing.
Images made from the varying wavelength/intensity signals will show variations in gray tones in black and white versions or colors (in terms of hue, saturation, and intensity) in colored versions. Pictorial (image) representation of target objects and features in different spectral regions, usually using different sensors (commonly with bandpass filters) each tuned to accept and process the wave frequencies (wavelengths) that characterize each region, will normally show significant differences in the distribution (patterns) of color or gray tones.