Remote Sensing Tutorial Overview
Contents
THE REMOTE SENSING TUTORIAL
OVERVIEW AND USE OF THIS TUTORIAL (CONTINUED)
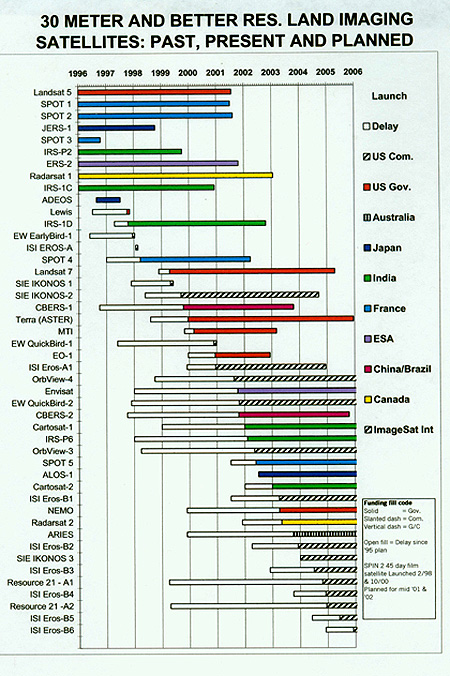
As this Overview continues, we presume that you may want to get a general picture of satellite activity between 1995 (near the end of the time in the satellite bar graph shown on the previous page) and 2005, which highlights the present and future plans for remote sensing systems. This graph gives a summary of many of the satellites, both governmental and commercial, scheduled for that time period (more details in Section 21 and several of the systems developed by the Europeans, Japan, India, Russia, Ukraine, and China-Brazil are described on page 23 of the Introduction).
Another way to obtain two vital particulars about some of these satellites is to examine a plot that shows maximum resolution and swath widths:
|Resolution and swath widths for some satellites either now in orbit or planned for launch in the near future; graph courtesy CNES. |
Additional relevant graphs are found on page 21-1
A Website that lists nearly all satellites currently tasked for earth observations is Remote Sensing Platforms and Sensors, maintained in the United Kingdom. Additional details on some of these satellites is given on the Website maintained by Ames Research Center (ARC). Of the group in the graph above, only ALOS (Advanced Land Oberving Satellite), built by the Japanese, has yet to be launched. You can check out its complement of sensors and status at their NASDA ALOS Home Page.
Even as privately-funded satellites are now orbiting the Earth (see below), many remote sensing operations are still very much government-driven (U.S. and International) when it comes to gathering information for the public good. Thus scientists, especially the academicians, and personnel in national agencies are charged with monitoring the Earth’s natural status, managing its land use and other resources, and looking beyond to the heavens. These people are constantly relying on a variety of satellites to conduct research, glean information pertaining to interpreting and predicting the environment, and devising new applications. Thus has developed a massive U.S. and multi-national program to study what is called the “Earth System”, in a vast project known as the Earth Science Enterprise (see all of Section 16).
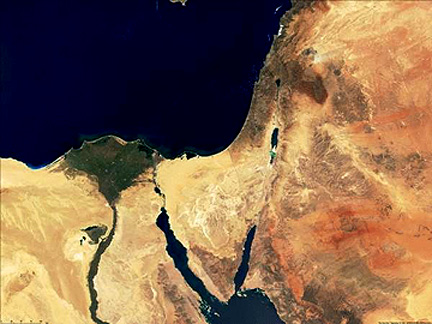
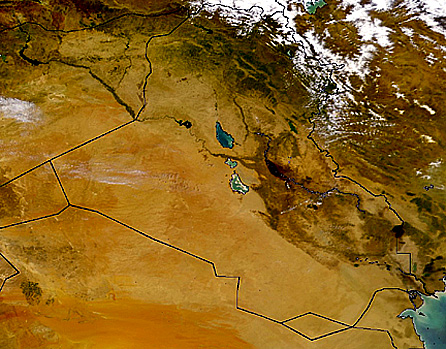
The “kick-off” to this endeavor, which will bring together thousands of investigators from many countries through at least the first decade of the 21st century, was the launch of Terra in late 1999. This spacecraft mounts 5 sophisticated sensor packages - ASTER, CERES, MISR, MODIS, and MOPITT - all looking simultaneously at the Earth’s land, oceans, botanical/organic forms , and climate to gain an integrated picture (the Earth System) of its environmental functions. The marvelous data sets, expressed as images, are on pages 16-9 and 16-10, if you want a preview of Terra’s continuing accomplishments. The companion satellite, Aqua, launched in 2002, is described on page 16-10a. For the moment, we will entice you with just one image, a MODIS view of the Middle East and Egypt where, as this is written, so much turmoil is threatening hopes for a meaningful peace between the Arab nations and Israel.
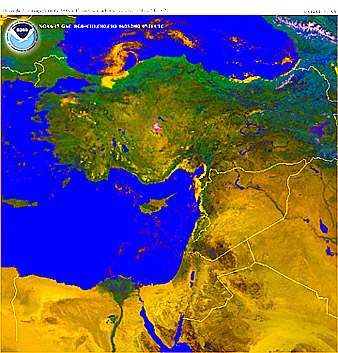
The meteorological satellites operated by NOAA also produce wide field imagery. The latest in the polar-orbiting series, NOAA-17, launched on June 24, 2002 produced, as its first image, this scene that covers some of the same regions shown in the MODIS image.
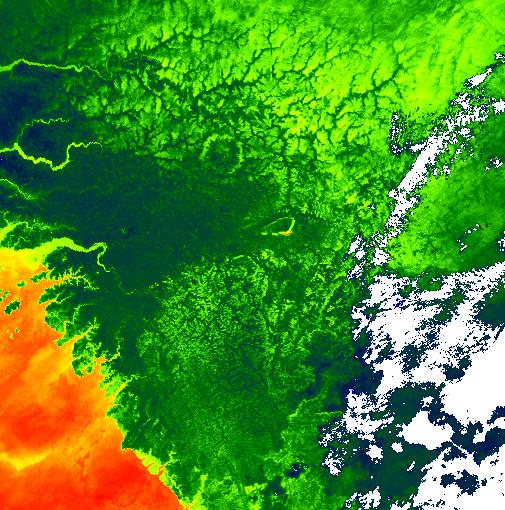
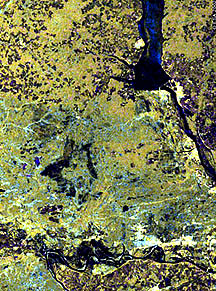
The European Space Agency (ESA) has launched two multisensor spacecraft, ERS-1 (1991) and ERS-2 (1995). The ATSR (Along Track Scanning Radiometer) produced this image of the western part of Africa (Senegal) in which the outline of a circular crater is seen in the tropical forest (green)
The ERS-2 radar produced this colorized image of part of Slovenia:

In late 2001 the European Space Agency launched (from near the equator in India) its first environmental “micro-satellite”, Proba, which weighed just 100 kg. Operating from a 600 km orbit, its principal instrument, CHRIS (Compact High Resolution Imaging Spectrometer) produces color images covering 18.5 km on a side at 18 m resolution. With 200 narrow bandwidth bands, this experimental satellite hosts one of the first of the new generation of hyperspectral sensors. Proba also has an imager, HRC, that yields black and white images at 8 m resolution. Here is one of the first CHRIS images, of Brugge, Belgium, in winter:
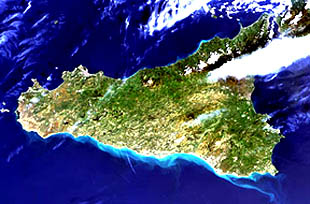
ESA followed up with the launch of its Envisat on February 28, 2002. With a swath width intermediate between OrbImage and Proba, namely 690 miles (1100 km), this satellite is designed to conduct primarily marine and atmospheric studies, as well as monitoring vegetation. Although its resolution - 300 m - is much less than, say, the IKONOS system, it has 15 individual spectral bands between 390 and 1040 nanometers, whose band widths allow almost continuous coverage of wavelength intervals in the Visible-Near IR segment of the spectrum. Its two principal sensors are MERIS (Medium Resolution Imaging Spectrometer) and ASAR, a radar unit. More about this satellite can be found at ESA’s Envisat Internet site. Below is part of a MERIS image showing the entire island of Sicily in approximate natural color.
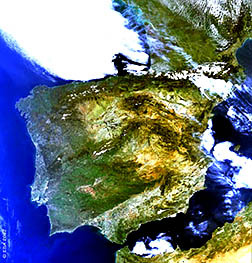
Beneath that is a full MERIS image (smaller scale; much wider area of coverage) of the Iberian Peninsula (Spain and Portugal), southern France, and Morocco in Africa.
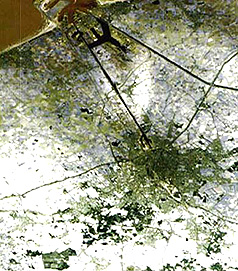
Envisat also carries 9 other instruments including the above-mentioned Advanced Synthetic Aperture Radar (ASAR). Other ASAR images are shown on Page 14-14. Below is an ASAR view of the Russian city of Dzerskinsk on the Volga River.
The commercialization of space imagery is currently the “hottest item” going in the remote sensing field, or perhaps we can now say “business”. You may also want to see some representative examples of the imagery now available to commerce and the public.
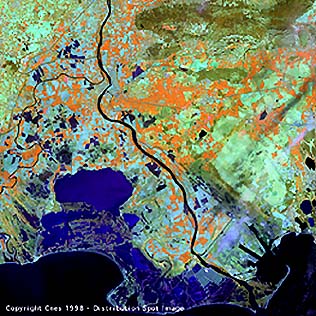
The first major company to enter the marketplace with quality imagery is SPOT-Image (Systeme Probatoire d’Observation de la Terre), which is associated with CNES (Centre National dEtudes Spatiale). (Click here or here to examine two versions of SPOT’s Internet home site.) This series of satellites has been launched on Ariane rockets from a base in French Guiana (northern South America). The headquarters and control center is in Toulouse, France. Formed in 1982, the organization has launched SPOT systems in 1986 (SPOT-1), 1990 (2), 1993 (3), 1998 (4), and, on May 3, 2002, SPOT-5. More on this program, including background on the sensors, on how SPOT produces stereo image pairs, and on applications, is found page 3-2. For now, we will show three images made by SPOT. The first shows the Rhone Valley in southern France where it enters the Mediterranean Sea, rendered in the SPOT multispectral mode (false color) at 20 meter resolution; the area covered is 50 x 50 kilometers.
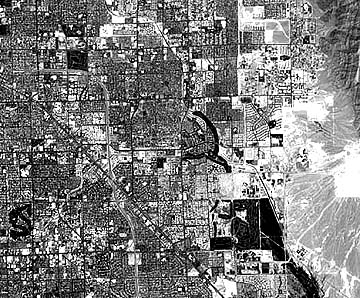
Next is a 10 meter panchromatic image from SPOT-4 covering a part of Las Vegas, Nevada, one of the fastest growing cities in America.
This image is the first made by SPOT-5 (launched on May 3, 2002), showing the port of Eleusis in Greece, imaged at 2.5 m by the new HRG (High Resolution Geometric camera), which puts SPOT-Image in direct competition with other, newer companies that operate high resolution systems.
|SPOT-5 HRC image of the harbor at Eleusis, Greece |
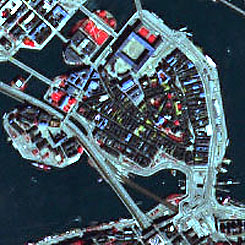
Another SPOT-5 image, in color and at 5 meter resolution, displays part of the Old Town of Stockholm, Sweden:
The panchromatic cameras on the SPOTs can be pointed off nadir to provide image pairs that are very effective in stereo viewing, as described on page 11-9.
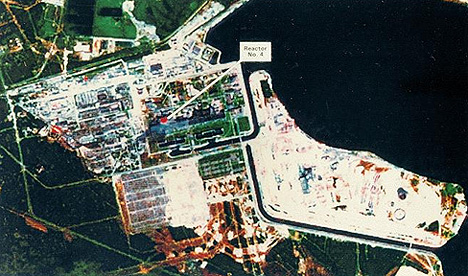
SPOT is one of many higher resolution satellites that can, if clouds are few, provide useful imagery of the effects of disasters. The SPOT-2 image below was taken in October of 1986, less than five months after the nuclear power plant explosion at Chernobyl in the Ukraine. Visible is the extensive damage around Reactor 4:
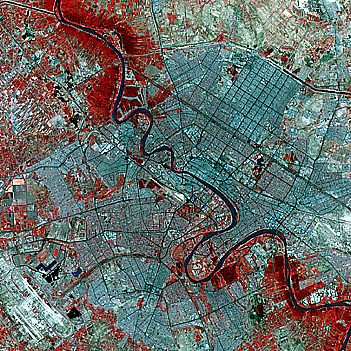
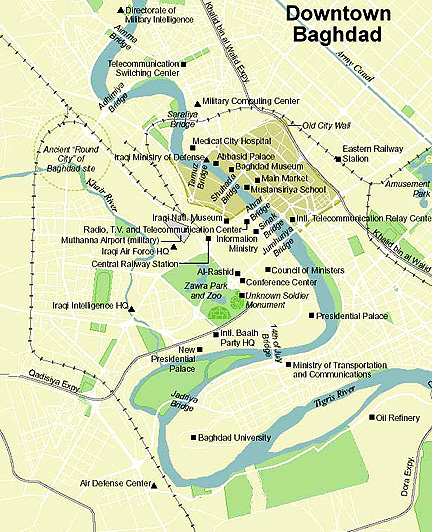
Another use is monitoring before and after effects of bombing during a war. The second Iraq war was well covered by satellite monitoring One of the SPOT-5 scenes has become very timely, indeed, as it shows the capital, Baghdad before it was attacked from the air. Below is a false color image of this city, cut into two halves by the Tigris River. A general map of Baghdad is reproduced beneath it:
Although it has undoubtedly slowed down some of the viewers of this Tutorial who have minimal loading rates, we decided to show much of Baghdad in the high resolution (2 meters) image produced by Quickbird-2 (see below) as an example of the details available to both the military and the public during the war with Iraq in Spring of 2003. Scroll to see the full extent; use the above map to local key features:

As war between the U.S., Britain, and other Coalition forces began with Iraq on March 19, 2003, both military and civilian (commercial) satellites with high resolution were daily observing much of that country with emphasis on places where weapons of mass destruction may be located. One group of prime targets are the many palaces of Saddam Hussein. One of these palaces is located in a bend of the Tigris River in the lower left part of this SPOT-5 panchromatic image:

The palace used for ceremonial and diplomatic activities is the (Old) Republican Palace on the Tigris further south than the above SPOT image. Here is an IKONOS satellite (see below) high resolution view of this complex:
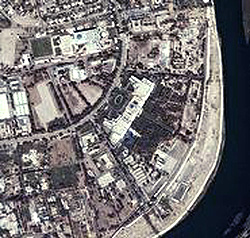
And still another walled palace - this the principal one used by Saddam Hussein - adjacent to an artificial lake, again imaged by IKONOS; this area is just left of bottom center in the natural color IKONOSimage - look for the lake pattern:

These palaces, along with government and military buildings and facilities, have been prime targets during the cruise missile and aircraft bomb attacks from the outset of the war. Below is a IKONOS-2 natural color image (resolution = 0.9 meter) of central Baghdad acquired on April 1, 2003 that shows smoke plumes from bombardment during the previous night. Referring to the very large Quickbird image above, see if you can determine the target buildings involved.

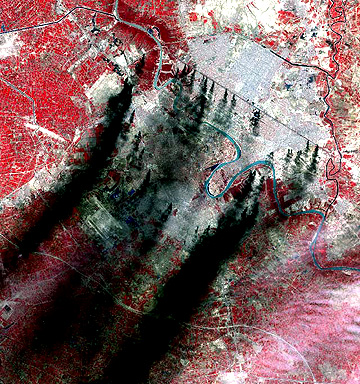
At about the same time, EOS’s ASTER sensor acquired this false color image of the greater Baghdad area, including the International Airport, visible between two smoke plumes (most of the smoke in this scene results from deliberate burning of oil ponds in trenches around the city by Iraqi defenders).
Of course, this war spread out over most of Iraq, so a full country view is in order. Below is part of an OrbView-2 image (see next paragraph and below) that shows this nation in its totality. Baghdad is located where a blackpatch represents the many oil fires burning on March 28, 2003.
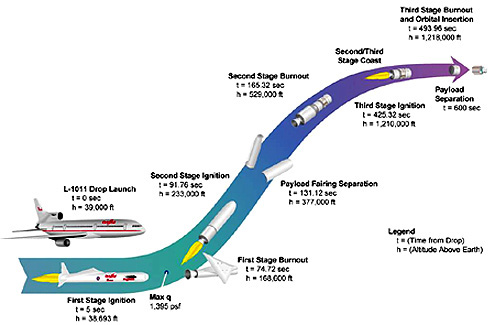
Returning now to the more halcyon days of peaceful uses of space images: the aforementioned American company, Orbital Imaging Corp., Dulles, VA (OrbImage) has now launched OrbView-1, OrbView-2, and OrbView-3. This last satellite was placed in orbit by having its rocket booster dropped from an airplane and then ignited (this mode, launch from a ground rocket, and launch from the Space Shuttle are the principal methods used to insert satellites in Earth-circling orbits). This diagram shows the steps in this procedure:
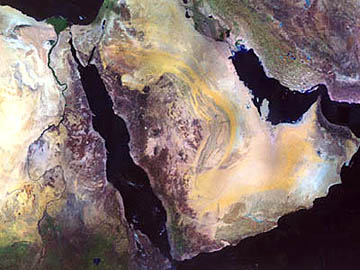
Here is an example of an OrbView-2 image (2800 km wide), in near true color, that embraces a wide area of Egypt, the Arabian Peninsula, and western Iran; Israel is in the top left center and Iraq is in the top right center.
Speaking of Israel, that country launched (from facilities in Russia) in December 5, 2000 its first commercial satellite dedicated to high resolution Earth observations. ImageSat International (ISI), established in 1997 and working with Israel Aircraft Industries and other companies, is now selling 1.8 meter (Standard) and 1.0 meter (Over Sampled) resolution panchromatic imagery from its EROS A1; this view of Izmir, Turkey is an example:

Another EROS A1 image of special interest is this view of the soccer stadium in Seoul, Korea which was one of several venues for the World Cup of Soccer matches in 2002:

A feature of the EROS A1 imagery is that stereo pairs are acquired. ImageSat had planned a follow-up EROS A2 but “scrubbed” this mission when the market for just panchromatic imagery proved a bit weak. They have now moved into the EROS B series which will have a 0.8 meter panchromatic sensor and a related system that will be multispectral. Launch of the first satellite will be in 2003, followed by others that will provide widespread and timely coverage.
Another American firm, Space Imaging, Inc. (Denver, with offices now in Europe and Asia) (Space Imaging) has been a distributor for IRS (Indian Remote Sensing) Satellite imagery. With both panchromatic and multispectral sensors, IRS can produce color images with 4 meter resolution. This example of Kobe, Japan (some months after an earthquake there) shows the detail available with that system (disregard the yellow squares; these insets will not enlarge):

Space Imaging is also building satellites of its own. The first in the IKONOS series failed during launch in April of 1999. The second IKONOS satellite was launched in September 1999 and has been operating successfully. Here is a panchromatic image of a part of downtown Washington, D.C., which can be further processed to attain 1 meter resolution. This image shows the Mall, the Ellipse, the White House, the Washington Monument, and many government and private buildings. But at the scale shown, individual automobiles are not resolved.

However, enlargement of a small part of the above IKONOS image shows the now realized potential of satellite imagery to disclose features, such as cars, approaching the full resolution of 1 meter. The circular building is the Hirshhorn Museum; the National Air and Space Museum and across the street, the building that once housed NASA, also appear.
1 meter resolution, showing an area around Independence Ave. (vertical) and 7th Street; among notable buildings are the Old Smithsonian, the National Air and Space Museum, and the Hirshhorn Museum of Modern Art.|
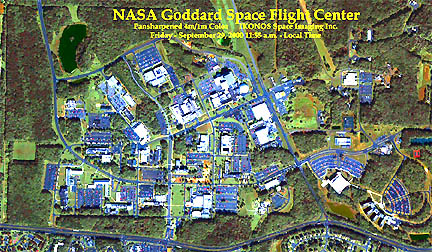
Just outside the famed Washington “Beltway”, in Greenbelt, MD, is the complex of buildings set in the forests of the Dept. of Agriculture’s BARC (a 10000 acre experimental station) which is the home of the Goddard Space Flight Center (GSFC) - which includes Code 935, the Information Sciences Branch, the original sponsor of this Tutorial. Here is GSFC as seen at 4 meter resolution by the IKONOS high resolution camera. The two buildings in the lower right are the home of the Earth Observations program and the Terra-EOS spacecraft personnel.
The ultimate in civilian remote sensing, for the present, is to achieve a resolution capable of seeing individual people from high orbital altitudes. IKONOS has achieved that - in this view of the famed Tiananmen Square in central Beijing, the scattered dots are actually native and foreign tourists moving about this heart of the capital city of China.
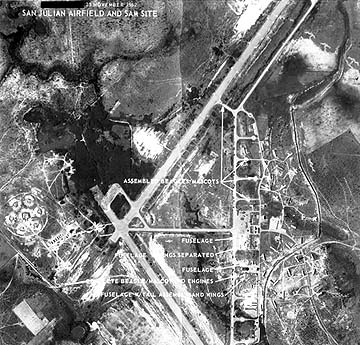
The advent of such high resolution civilian remote sensors has moved remote sensing close to the capabilities once reserved exclusively for military surveillance systems (see Page Intro 26e). Over the years, military and intelligence monitoring of sensitive targets from air and space has consumed much more resources (i.e., currencies) than civilian programs. Spy satellites, either deactivated now or in current operation, have had a significant, but seemingly indirect, impact to civilian earth- and space-observing systems. Their principal contribution, or driving force, has been development of technologies (much directed towards high resolution) that, years later, have been declassified to an extent that civilian systems could incorporate some of the capabilities (these developments were often accomplished independently by NASA and other space agencies but until recently governments prohibited their use in these systems. To illustrate what military surveillance can do, we look at two images now. The first involves aircraft reconnaissance over Cuba during the 1962 missile crisis:
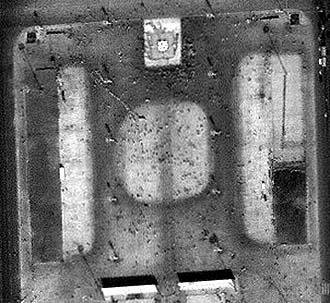
The second example shows an image of an Iraqi military facility during the 1991 Gulf War, using an optical scanning sensor on a KH-11 satellite:
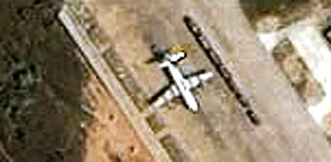
The breakthrough in bringing the resolution of satellite imagery into the range of aerial photography occurred in the late 1980s. When the Russians began to sell high resolution imagery on the open international market, this led to a reassessment by the U.S. and other countries of their policy to hold NASA and other countries and organizations that make their remote sensing data public to limits around 15-20 meters. Now, commercial systems can release 1 meter resolution imagery, giving detail approaching “spy satellite” status. But for now, as an example of what civilian systems can do in reporting on a military system, we show here the image of the U.S. Navy EP-3 Reconnaissance aircraft on Hainan Island off the China coast where it was forced to make an emergency landing in late April, 2001 after a partial collision with a Chinese Jet fighter. The image was produced by Space Imaging Corp. using IKONOS 2 (altitude 680 km [about 420 miles]).
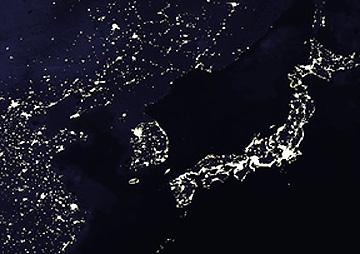
Satellite imagery can sometimes be used to make a political statement. This is evident in this DMSP (Defense Meteorological Satellite Program) nighttime image of parts of China, Japan, and Korea. The white tones correspond to well-lit cities. The southern half of Korea, namely South Korea, is largely well-illuminated, a sign of a high level of prosperity. By contrast, North Korea is almost dark. Yet this is the “rogue” nation, which keeps its citizens in the dark, that has continuously threatened its neighbors and much of the world with its limited but dangerous nuclear capability. This is a classic example of an economically weak nation using its military power to achieve political gains
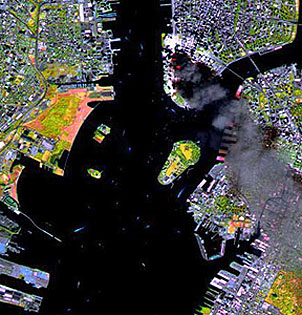
Another example of use of imagery that may have political overtones: One powerful use of these higher resolution satellites is in rapid monitoring of an area subjected to a natural or human-caused disaster. The worst manmade catastrophe in American history took place on September 11, 2001 (now known simply as “9/11”) when Al-Quaeda terrorists attacked New York City, the Pentagon outside Washington, and an aborted attack on the U.S. Capitol that ended in Pennsylvania. This was dramatically demonstrated by the imaging within two days of Lower Manhattan in New York City when the twin towers of the World Trade Center were destroyed by those terrorists using highjacked U.S. commercial airliners as “rockets” loaded with explosive jet fuel. The first image below was taken by the French SPOT-3 satellite just 3 hours after the first impact.
IKONOS-2 took the image below of Lower Manhattan nearly two years after 9/11, in which the changes around the “ground zero” area of the World Trade Center are evident. Even higher resolution IKONOS-2 images are presented on page 4-2.
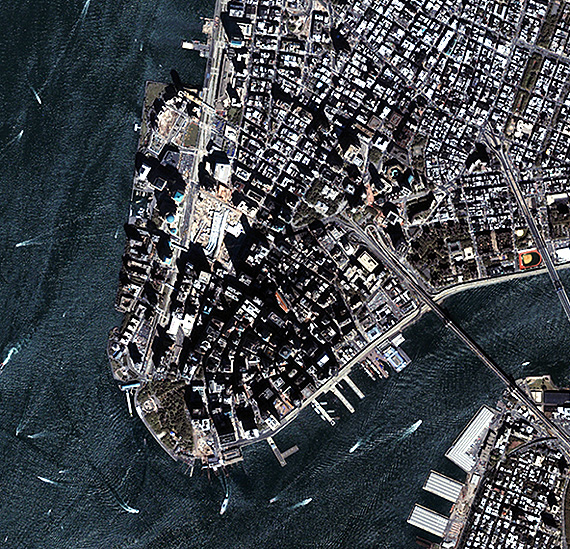
These last images are symbolic of a “great leap forward” in remote sensing, that is, the emergence in the 21st Century of private, commercial satellite operations rather than continued dependence on NASA/NOAA, space agencies in other countries, and the military to provide useful imagery of the planet we live and work on.
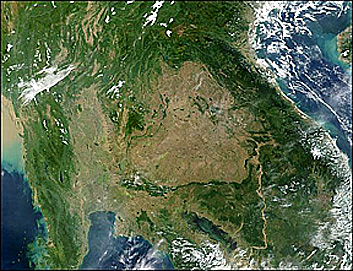
A recent high resolution commercial satellite is QuickBird 2, built by Ball Bros. and operated by Digital Globe (formerly known as EarthWatch), launched on October 18, 2001 to an orbit at 280 km. Its color imagery (an example from the Antarctic is shown on page 7-3) can achieve a resolution of 2.4 m (9 ft). Its black and white imagery attains a resolution of 0.65 m (2 ft). We saw the Quickbird-2 image of Baghdad above on this page. To set the stage for several more examples we will first look at a wide angle scene made by the MODIS sensor on Terra which covers most of Vietnam, Cambodia (note Mekong River), Thailand, and part of Malaysia; the greens denote the thick jungles that were such a difficult terrain in which to fight during the Vietnam War but observe that much of Thailand has been deforested (browns):
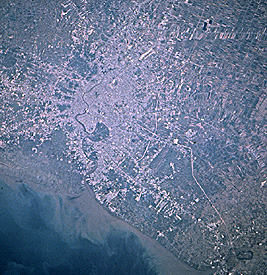
From this regional view, we will zero in on one of the great cities of Asia, Bangkok, in southern Thailand. As a start let’s look at an older photo taken from space by an astronaut. On the whole, it is not sharp or well color-balanced and rather dark. Until the last decade, astronaut photography was hit and miss, with many like the one below. Some pictures were excellent; most were tantallizing but unsatisfactory. Part of the problem was the inability to remove haze or atmospheric moisture. (See Section 12 on Astronaut Photography for more details.)
From this next image, made by Terra’s ASTER, you will like concur that this type of image is superior to the above astronaut photo in capturing information about Bangkok.

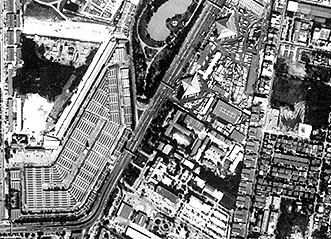
To further appreciate the value of high resolution space imagery, this next image (2 meter resolution) comes from the KVR-1000 photographic camera operating from the Russian SPIN-2 satellite (the photos taken are developed onboard, scanned digitally, and then sent as signals to a ground facility in southern Russia) The image covers part of central Bangkok:
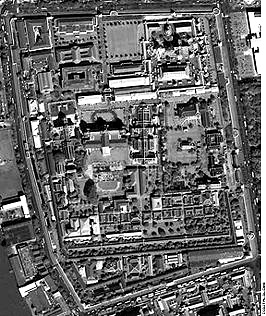
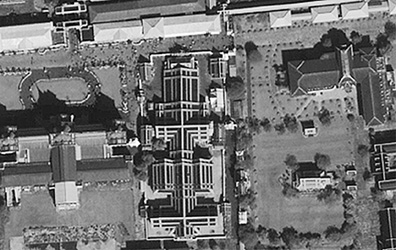
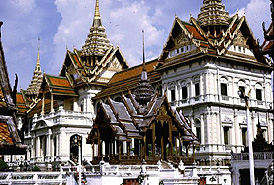
The next pair of images, made by QuickBird, show a high resolution (4 meters) on top and then a very high resolution (1 meter) view of the city that contains the famed Royal Palace in Bangkok. Try to fit the bottom image into the top one:
As a related aside, the writer (NMS) had the privilege of being given a tour of this fabulous palace by a member of the Royal Family when I was part of a two-man mission to Bangkok in 1975 to participate in a Symposium sponsored by the Thais that featured the uses of the ERTS-1 (Landsat-1) satellite. Here is just one of the numerous photos I took of this Palace:
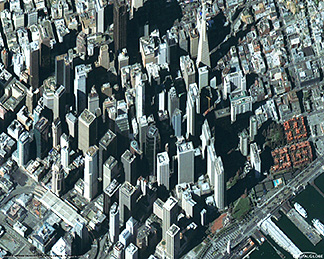
Just as we have seen with the IKONOS high resolution color imagery, Quickbird too produces stunning scenes. Compare the Quickbird scene of downtown San Francisco shown here with an almost identical coverage provided by IKONOS near the bottom of Page 6-9
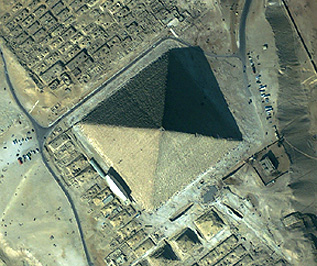
And, consider this superb Quickbird-2 image of the Great Pyramid of Giza, southwest of Cairo. This imposing structure dates around 2600 B.C.
Quickbird-2 has, with its panchromatic scanner, obtained imagery with the highest resolution yet achieved (and allowed by national security interests): namely, 0.67 meters (about 2 feet). Digital Globe has released this example - a scene dominated by the giant Ferris wheel (115 meters high) in a Tokyo, Japan amusement park:
|Quickbird panchromatic image said to boast a resolution of 2 feet (this is not evident in this Internet version but would be verifiable in a high quality photo print) of the monorail and Ferris Wheel at |
Radar images made from orbiting spacecraft are also available for purchase. One of the earliest systems is Radarsat, launched in November 1994 and operated by the Canadian Space Agency . The commercial unit is RadarsatInternational (RSI). Radarsat utilizes the C-Band by itself to make its imagery. Below is an example of a Radarsat image; others are found on ` <../chapter04/Sect4_2.html>`__. The scene shows the Dead Sea south of the Jordan River.

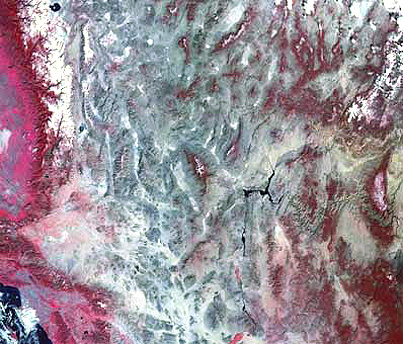
Another trend in satellites has been to put the same or complementary sensors on a group of satellites that work together to accomplish their mission. In some instances, this configuration is called “formation flying”, in that several satellites are located or spaced in orbit such as to look at the Earth under different conditions (e.g., time of day) or with a higher frequency of coverage. In March, 2003, the first of a planned 4 ALSat satellites was launched successfully; the other three will follow later in the year. When all are operating, they will allow any spot on Earth to be covered at least once in a 24-hour period (assuming suitable cloud cover conditions). With wide area coverage at moderate resolutions (34 m under one mode), this will allow them to function as disaster monitoring systems. A fuller description of their capability is given on page I-23. Here is an ALSat-1 image of a 600 km wide scene extending from the Great Valley of California across southern Nevada into Utah:
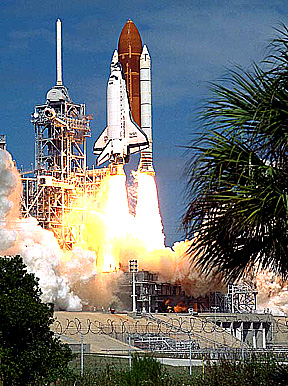
When the word “NASA” is presented to the “citizen in the street”, the first image that usually comes to mind is that of the Space Transport System (STS), more commonly known as the Space Shuttle. Shown here as a mission is launched, the Shuttle, at the heart of America’s space program in the last 25 years (although at present “grounded” following the Columbia disaster) has been involved in many scientific and technological projects, some of which are directly involved in remote sensing applications.
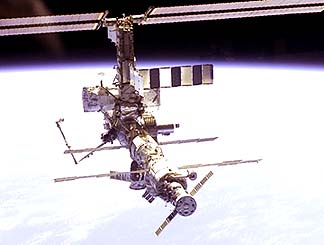
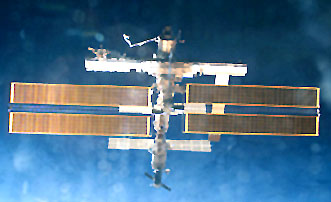
Although for the past ten years or so the centerpiece of the NASA program, along with participation by other nations, has been the International Space Station (ISS), it may seem as though (in the year 2003) this massive effort to put another permanent facility (the Russian MIR was first) is given little attention in this Tutorial. This is not quite the case: astronaut photography is conducted from ISS and in time various remote sensors will be installed and tested aboard this space “home”. For now, we will only allude to this potential by showing two pictures of ISS taken by astronauts on Space Shuttle mission 110 in June of 2002. As more remote sensing output is produced during future missions, examples will be added to this Remote Sensing Tutorial (RST).
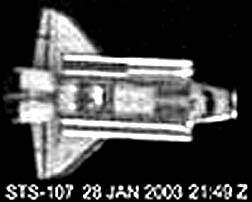
Currently, and probably for the rest of 2003, the ISS is operating at a minimal level owing to the inability to bring new components to its continuing construction using the Space Shuttle. The Shuttle appears to be grounded indefinitely as a result of the Columbia disaster. When the Shuttle returns to space, it is planned to monitor it in flight from above for evidence of damage or other trouble. Various imaging satellites, mainly military, can image it when it is in their view. Several images of Columbia were obtained just days before the accident by satellites, once again illustrating the great versatility and value of remote sensing observations from space. Here is one of the images released during the investigation phase:
Many more satellites and space probes for both Earth and Astronomical applications are on the drawing boards for future launches. Some of these systems were described above; others in Section 21. For those who want the “latest” in space achievements and updates on launch schedules, we recommend the SpaceFlight Now Web site, which is updated daily (this one is worth adding to your Favorites list).
As we approach the close to this Overview (but don’t neglect to examine the credits and biographies below), we will now offer you a chance to test your innate knowledge and reasoning skills about some general ideas involved in scene interpretation using remote sensing products. Following a suggestion by a colleague, there will now be an optional “Get Acquainted” Quiz using a variety of remote sensing products that relate to just one part of the United States. We invite (urge) you to click `here <OverviewActivity.html>`__ to access the Quiz page that displays the images and tests your experience and common sense through 10 leading questions. When done, either return to the Overview using the Back button or click as advised to the Introduction.
So, now on to the Tutorial itself. Start by returning to the Table of Contents on the Title Page, which you can access by clicking on either the Foreword or What’s New buttons below, or through the proper sequence of steps hitting your browser’s back button.
(In keeping with scientific convention and the intended worldwide use of this Tutorial, we normally specify measurements in metric system units (si), especially those for the electromagnetic spectrum and other units in physics. We will place English unit equivalents in parentheses where appropriate or to clarify, particularly when dealing with geographic parameters.)
ACKNOWLEDGEMENTS
This Tutorial is the outgrowth of a suggestion by **NICHOLAS M. SHORT, JR., who at the time was a computer scientist at Goddard’s Code 935 (the first sponsor). He conceived the idea in part as an alternative source of information on remote sensing to the writer’s (NMS) Landsat Tutorial Workbook (now out-of-print) for which requests continued over the years to funnel through him, as a consequence of his name recognition (and confusion).**
Since its inception, the following have served as Webmasters who also assisted in putting the Tutorial into proper “html” format: Dr. John Robinson; Mr. William Dickinson, Jr.; Mrs. Nanette Fekete; Ms. Stephanie Richardson; Mr. David Hudgins; Mr. John Bolton. Their help in this capacity is gratefully recognized by the Primary Writer, N.M. Short, Sr.
We also thank Mr. Robert Rush of Numidia, PA for his technical assistance to the principal writer in preparing the inputs to the Web Site. Mr. Rush has over ten years of experience in the computer technology field. He currently operates Webmaster Choice, an international company providing website design and hosting. This input, done at the writer’s computer, was then ably tailored for the Net by workers at NASA-Goddard Space Flight Center and Global Scientific and Technology, Inc. (GSTI).
In July of 2002, we were most fortunate in getting one of our Web site readers to volunteer to proofread the text portion of the Tutorial for “typos” and other non-technical errors. We are grateful to Mr. Joe Lane, of Brooklyn, NY for performing this vital service. Mr. Lane, was one of the original members of the “Swing n Sway with Sammy Kaye” Big Band, well known in the mid 20th Century; this band today (even after its leader passed away) still plays professional concerts, mostly in the northeast U.S.
The following are synoptic biographies of the principal author - also referred to in various Sections as the “writer” or “(NMS)” - of the Remote Sensing Tutorial and of the major topic contributors, plus listings of others involved in the preparation of this Tutorial:
PRIMARY AUTHOR
Dr. Nicholas M. Short, Sr. (nmshort@nationi.net)
 Dr.
Short, a native of St. Louis, MO, is a geologist who received degrees in
that field from St. Louis University (B.S.), Washington University
(M.A.), and the Massachusetts Institute of Technology (Ph.D.); he also
spent a year in graduate studies in the geosciences at The Pennsylvania
State University. In his early post-graduate career, he worked for Gulf
Research & Development Co., Pittsburgh, PA (Wyoming Oil project), the
Lawrence Livermore Laboratory, California (Underground Nuclear
Explosions; Plowshare Program), and the University of Houston (Associate
Professor). During the 1960s he specialized in the effects of
underground nuclear explosions and asteroidal impacts on rocks (shock
metamorphism), and was one of the original Principal Investigators of
the Apollo 11 and 12 moon rocks. He joined NASA’s Goddard Space Flight
Center in 1969 as one of the first discipline specialists supporting the
Landsat program. Over the next 19 years, he authored Planetary
Geology, The Landsat Tutorial Workbook, and The HCMM Anthology and
co-authored Volcanic Landforms and Surface Features, Mission to
Earth: Landsat Views the World, and Geomorphology from Space, along
with publications dealing mainly with geological remote sensing. After
retiring from NASA in 1988, Dr. Short taught remote sensing at
Bloomsburg University in Pennsylvania until 1992. From 1992 to 1994 he
was a national Sigma Xi lecturer. He began work on the Remote Sensing
Tutorial in 1995.
Dr.
Short, a native of St. Louis, MO, is a geologist who received degrees in
that field from St. Louis University (B.S.), Washington University
(M.A.), and the Massachusetts Institute of Technology (Ph.D.); he also
spent a year in graduate studies in the geosciences at The Pennsylvania
State University. In his early post-graduate career, he worked for Gulf
Research & Development Co., Pittsburgh, PA (Wyoming Oil project), the
Lawrence Livermore Laboratory, California (Underground Nuclear
Explosions; Plowshare Program), and the University of Houston (Associate
Professor). During the 1960s he specialized in the effects of
underground nuclear explosions and asteroidal impacts on rocks (shock
metamorphism), and was one of the original Principal Investigators of
the Apollo 11 and 12 moon rocks. He joined NASA’s Goddard Space Flight
Center in 1969 as one of the first discipline specialists supporting the
Landsat program. Over the next 19 years, he authored Planetary
Geology, The Landsat Tutorial Workbook, and The HCMM Anthology and
co-authored Volcanic Landforms and Surface Features, Mission to
Earth: Landsat Views the World, and Geomorphology from Space, along
with publications dealing mainly with geological remote sensing. After
retiring from NASA in 1988, Dr. Short taught remote sensing at
Bloomsburg University in Pennsylvania until 1992. From 1992 to 1994 he
was a national Sigma Xi lecturer. He began work on the Remote Sensing
Tutorial in 1995.
In December of 2002, the writer was asked to contribute a lengthy article on his experiences in becoming a remote sensing specialist (summarizing most of his professional career) to a new Web site called The Online Journal of Space Communication, accessed over the Web at this URL address. For those interested, the article, which will be part of the 3rd issue this Journal, is entitled MEMOIRS OF A RETOOLED GEOSCIENTIST. It is also bundled in the CD-ROM as a folder entitled Memoirs.
GUEST WRITERS & CONSULTANTS
Dr. Paul D. Lowman Jr. (lowman@denali.gsfc.nasa.gov) Section 12: The Human Remote Senser in Space - Astronaut Photography ——————————————————————–
Paul Lowman is a geologist, with degrees from Rutgers and the University of Colorado. He was hired by NASA in 1959, the first geologist to be employed by the agency. He took part in the Mercury, Gemini, Apollo, and Skylab programs as principal investigator for terrain photography. He was Principal Investigator for a Shuttle Imaging Radar Experiment, covering the Canadian Shield, in 1984. His current work is concentrated on a digital map of global tectonic activity, published (Lowman et al., in the Journal of Geoscience Education, v. 47, p. 428-437, 1999). His is also completing a book “Exploring Space, Exploring Earth: the Impact of Space Flight on Geology and Geophysics,” for Cambridge University Press.
Scott Madry (madry@informatics.org … http://www.informatics.org/madry/madry.html) Section 15: GIS Burgundy, France application study ———————————————————————————–
Dr. Madry received his Ph.D. in Anthropology from the University of North Carolina at Chapel Hill in 1986, specializing in the applications of remote sensing and GIS for cultural studies. He has been a Senior Project Manager at the Institute for Technology Development’s Space Remote Sensing Center at the NASA Stennis Space Center, was the Senior Associate Director of the Center for Remote Sensing and Spatial Analysis at Rutgers University, and was a member of the Faculty of the International Space University in Strasbourg, France for over ten years. Dr. Madry has been involved in teaching and research in remote sensing and GIS applications for over 15 years, and has conducted a variety of research and application projects in Europe, Africa, and North America. He has been involved in projects ranging from European archaeology to Mountain Gorilla habitat studies in Rwanda and wildlife management in Kenya’s National Parks. An entertaining and engaging speaker, he has given over 125 short courses and seminars in over 25 countries, including lectures at the Sorbonne. He is currently the president of Informatics International, Inc., an international Geomatics consulting firm in Chapel Hill, NC. He also holds an appointment as a Research Associate Professor of Anthropology at the University of North Carolina at Chapel Hill. He was awarded the prestigious Russian Konstantin Tsiolkovsky Gold Medal in 1997 for his contributions to international space education.
Dr. Mitchell K. Hobish, Consultant (mkh@sciential.com) Section 16: Earth Systems Science - Earth Science Enterprise and the EOS Program ——————————————————————————–
Dr. Mitchell K. Hobish is self-employed as a consulting synthesist, specializing in scientific and technological strategic planning and outreach. Dr. Hobish has worked with scientists and space agencies world-wide to develop concepts and approaches for efficient utilization of analytical laboratory methods for space exploration that also have high spin-off potential for terrestrial use. He is a partner (with his wife, Janice) in New Realities, LLC, a consulting firm dedicated to making technical and scientific information accessible to the general public. Dr. Hobish holds undergraduate degrees in English (with a minor in electrical engineering) from the University of Rochester, and biology, from Tulane University. He received his doctorate in biochemistry from the Johns Hopkins University. Dr. Hobish has performed research in the physicochemical origins of the genetic code, the origins of chirality in biomolecules, and the thermodynamics of small molecule binding to biomacromolecules. When not working, he builds small robots and is an amateur radio operator. He also does volunteer work for the IEEE and AIAA in the areas of student outreach and education. His Web page may be viewed here.
William E. Stoney (wstoney@mitretek.org) Section 21: Remote Sensing in the 21st Century ———————————————-
Subsequent to a varied history in NASA, including Project Manager of the Scout launch vehicle, and Director of Engineering for the Apollo Program, Mr. Stoney began his career in satellite remote sensing as Director of NASA? Earth Observation Program in 1972, the year that Landsat 1 was launched. His tenure included the launch of Landsats 2 and 3, the definition and development of the Thematic Mapper, the development of NOAA’s TIROS, and GEOS satellites and sensors, and the management of the Large Area Crop Inventory Experiment (LACIE) and the Application Research programs which initiated the development of multispectral analysis technologies. Since leaving NASA he has worked for RCA and GE supporting the development of the EOS program and for MITRE and now Mitretek supporting the current and future Landsat systems. Recently he has been closely involved with the Stennis Science Commercial Commercial Data Buy Program.
Jim Rosalanka (jrosalanka@worldnet.att.net) Appendix A: The Modern History of Space ————————————————————————————-
James J. Rosolanka, who recently retired from the USAF, presently works for AMCOMP Corporation as a Senior Systems Engineer. While in the USAF, he worked in various facets of the military space field. He began at the Satellite Test Center, Sunnyvale Air Force Station, California (now Onizuka Air Force Base) in 1980 supporting spacecraft operations. In 1984, he transferred to Space Systems Division, Los Angeles Air Force Base where he worked with the Secretary of the Air Force Special Projects, and then with the Titan IV Launch Vehicle Program Office. In 1989, he moved to Colorado to support the operational testing of the Consolidated Space Operations Center (CSOC), Falcon Air Force Base (now Schriever Air Force Base). In 1994, he transferred back to the Space and Missile Systems Center, Los Angeles Air Force Base, where he served the Defense Support Program (DSP) office in several key positions before retiring. He currently works on the Air Force Satellite Control Network (AFSCN).
Jeff Love, PIT Developer (love@gst.com) Appendix B: Interactive Image Processing —————————————-
Mr. Love received his B.S. and M.S. in Computer Science from the University of Missouri - Rolla. He has experience designing and developing real-time data acquisition systems deployed on U.S. Navy Submarines. Mr. Love was also responsible for the development, maintenance, and support of the Common Data Format (CDF) which is used by the space physics community to store scientific data sets. More recently, he has been providing programming support for NASA GSFCs Regional Application Center (RAC) program, including the development of the Photo Interpretation Tool (PIT) used in Appendix B of this Tutorial.
Dr. Jon W. Robinson (robinson@ltpmail.gsfc.nasa.gov) Appendix C: Principal Components Analysis —————————————————-
Dr. Robinson received his B.S. in Zoology from the University of Michigan, Ann Arbor, He received his MA and Ph.D. in Systematics & Ecology from the University of Kansas, Lawrence. After completing his Ph.D. he worked at the Center for Research. Inc. at the University of Kansas with some of the first Landsat data. He then worked as a Biometrician at the Museum of Natural History, Smithsonian Institution. Since 1976, he has worked for a number of contractors at NASA/Goddard Space Flight Center. He currently works for Hughes STX Corporation. Over the years, he has worked with data from a variety of platforms and sensors including Heat Capacity Mapping Mission (HCMM), ), Geostationary Operational Environmental Satellite (GOES), Landsat, ASAS and AVHRR. Dr. Robinson worked in the Eastern Regional Remote Sensing and Applications program at Goddard Space Flight Center during the late 1970’s. This program was designed to help transfer remote sensing technology to state and local governments, and the private sector. He was a member of a two person team, training members of the Chinese Academy of Sciences in remote sensing when his employer installed the first Landsat ground station in China.
Jeff Weissel (jeffw@ldeo.columbia.edu) Glossary ————————————–
Dr. Weissel received his BSc (Hons.) in Geophysics from the University of Sydney (Australia) in 1968, and his PhD in Marine Geophysics from the University of New South Wales in 1972. Since then he has worked at the Lamont-Doherty Earth Observatory of Columbia University in Palisades, New York, where he is currently a Doherty Senior Scholar. His research interests focus on the evolution of landscapes and seascapes, with a particular emphasis on slope failure and landslide hazards. Application of remote sensing techniques to the detection and mapping of landslides is an important element of this research. NASA supports Dr. Weissel’s work through its Topography and Surface Change and Solid Earth and Natural Hazards research programs. The remote sensing glossary was developed to help students taking Dr. Weissel’s courses on remote sensing principles and applications at Columbia become familar with the ever-expanding terminology of the discipline.
EDITOR (1998-2000)
William B. Dickinson Jr. (wdickins@gst.com) Webmaster ——————————————-
Mr. Dickinson received his B.A. in History from the University of Maryland College Park Campus, specializing in ancient Roman history and archaeology. He is currently employed by Global Science and Technology. He has several years of experience designing, developing, and maintaining websites and has a solid understanding of multiple computer systems and their relation to the World Wide Web. He has recently served as Coordinator for the Regional Applications Center (RAC) program in Code 935 at NASA GSFC, and has been the Editor and Webmaster for the Remote Sensing Tutorial project for the past 3 years.
PUBLICATIONS & WEB SERVICES
Colonel (Retired) Doug Kirkpatrick (dkirkpat@clsp.uswest.net)
Col. Kirkpatrick received his B.S. from the Air Force Academy in 1974, an MS from Purdue University, and a Ph.D. from the University of Texas in 1988. His service includes instructorships at the Air Staff and Command College and the Air War College.


COORDINATORS

 Northern NEF
Northern NEF, Inc. (NEF) is a small business firm with primary corporate offices in Colorado Springs, Colorado. Other offices are located in Oklahoma City, Oklahoma; Mechanicsburg, Pennsylvania; Denver, Colorado; Dayton, Ohio; Ankara, Turkey; and Riyadh, Saudi Arabia. Established in 1987, the company has grown from a start-up in Colorado Springs to an expanding worldwide business.
NOTE: The Next button takes you to the “Get Acquainted Quiz”.