Remote Sensing Tutorial Page Section20-2a
Continuation of Galaxies Page
Both galaxies and stars (see page 20-5) come in diminutive sizes to which the term “dwarf” is applied. A Dwarf galaxy can be irregular in shape but spheroidal, elliptical and compact varieties occur.
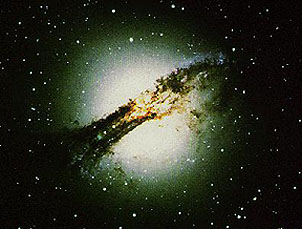
Cena-Centaurus is classed as a Dwarf Elliptical that is nearly spherical and possesses a huge ring of dust and gas around its “equator”:
Two further categories of dwarfs: gas-rich, with active star formation, and gas-poor, with dominantly old stars. The paucity of gas may mean that supernovas in the galaxy were able to drive off (expel) that gas because the low numbers of stars fail to provide enough gravitational stability to retain the extra-stellar gases. A Dwarf galaxy is typically around 6000 light years in maximum dimension, contains from 1 to 10 million solar masses of gas made up of atomic hydrogen (larger galaxies contain dominantly molecular hydrogen). The dwarfs may be very abundant throughout the Universe, and some current estimates hold them to be numerically more common than the billions of spiral and elliptical types (but because of their smaller sizes, most still remain undetected because of their much lower luminosities. Some Dwarf galaxies, if locally in sufficient numbers, likely merge to form larger galaxies that then evolve into Spirals or Ellipticals (again, see paragraphs near bottom of this page). Because of its small size, such a galaxy is more often detected as a source of infrared and radio radiation. However, a few have been imaged optically, such as NGC 4214 (top) and NGC 5253 (bottom):

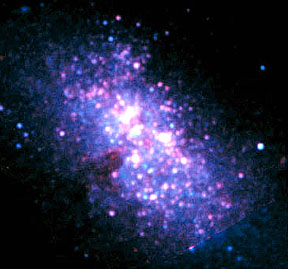
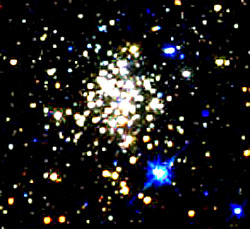
Embedded in these views are bunched clots of very hot, bright stars (each, typically, around 20 solar masses). These are created intermittently over short periods of time (for most of their history, dwarf galaxies tend to be quiescent in terms of new star production) at rates up to 100 times greater than spiral galaxies (in the latter, a new star is generated on average once a year over the entire system). They result in what are termed “starbursts”, a situation that is a hallmark of dwarfs. The Arches cluster is a good example:
During the bursts, the entire gaseous cloud is heated (thus increasing its radiation and improving detectability). These sporadic bursts are postulated to be caused by interactions with larger galactic clouds or by collisions between two dwarfs. Because most of the dwarf’s hydrogen gas is not converted into elements such as carbon, nitrogen, and oxygen (see page 20-7), this galaxy type is primitive, more like the galactic clouds in the early Universe. The importance of Dwarf galaxies is that they could be a major contributor to the as yet unaccounted for (missing) mass (see below) needed to control the Universe’s expansion (see page 20-9).
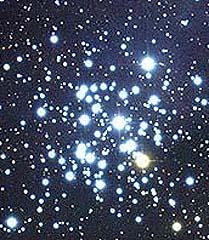
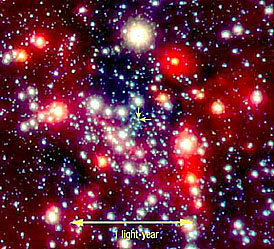
Clusters of very massive, bright (blue-white) stars are much rarer, since stars of this size tend to burn out far more rapidly. Here is an unnamed cluster of large stars which is probably not a starburst.
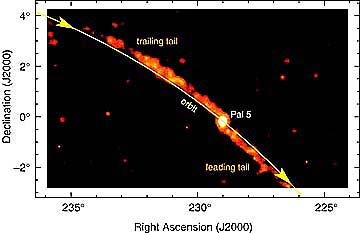
Some star groupings as seen now contain as few as ten thousand individuals to a million or more. They have been called halo clusters. Uncertainty persists as to whether these simply did not ever grow larger or represent once bigger clusters that have lost much of their population. This next image, made by a Palomar telescope involved in the on-going Sloan Digital Sky Survey (SDSS), shows one such cluster 5000 l.y. away in the Milky Way’s halo in which mass is being removed as a pair of opposing tails owing to gravitational disruption as the group passes in a high angle orbit through the halo to distances where the central mass of stars exerts enough force to be pulling the cluster apart. Astronomers think now that shredding of halo clusters over time is the norm.
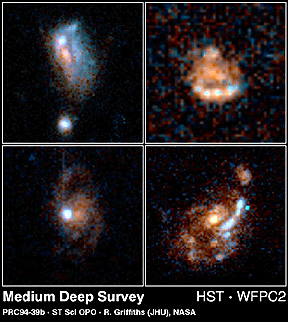
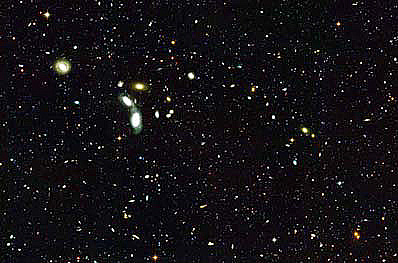
Another category of galaxies is referred to as irregular or sometimes peculiar. Though usually having much fewer stars that the spiral or elliptical galaxies, these still contain millions of stars. This group of four, found at distances of several billions of light years, illustrate the seemingly poorly organized morphologies of irregulars:
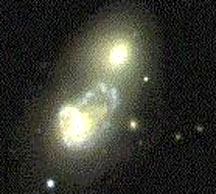
One type of irregular galaxy is thought to be caused by two galaxies in process of colliding (see below), as seen in this HST image:
Another class of irregular galaxies is known as faint blue galaxies. The HST has located large numbers of these at distances from 3 out to 8 billion light years. Several faint blues appear in this mid-field image:
|An HST image containing three distinct irregular galaxies, at least two of which are of the faint blue type. |
The population of faint blue galaxies seems to increase the further out (back in time) a telescope can conduct an inventory. This accounts for the “faintness” of these hot star groups. That suggests these, and at least some of the irregular types, formed early in Universe time. Some never organized into the regular types or have been dissipated by burnout of most of their stars.
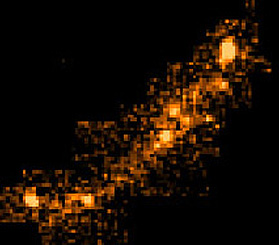
This view is supported by HST’s discovery of a galaxy approximately 13 billion light years from Earth, in the process of forming during the initial organization of galaxies. This galaxy, one of the most distant yet found, appears as an arcuate red smear, which is a distortion of its probably irregular shape by the process of gravitational lensing described in the Preface of this Section.
|Possibly the galaxy farthest from Earth, imaged as a red smear (caused by gravitational lensing) by the HST Wide Field Camera. |
Individual galaxies of the main types are separated by distances of up to millions of light years. Despite these large separations, collisions between galaxies (one tends to “pass” through the other) have been observed (see page 20-4) and may well be common. Galaxies tend to be grouped in great clusters or even superclusters (collections of proximate clusters) arranged commonly in elongated bands or strings that began aligning about 1-2 billion years after time zero. The elliptical galaxies are more abundant than spiral in these superclusters. Intergalactic space between superclusters contains lower numbers of galaxies, in regions the decrease may be so sharp as to warrant the term “voids”. The distribution of the different types of galaxies (each of which varies over a range of absolute magnitudes [expression of luminosity; see page 20-5] depends in part on the density of galaxies in a given volume of space. Consider this diagram:
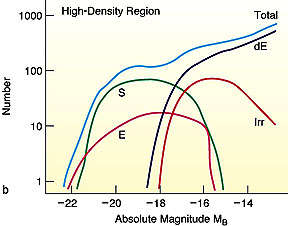
Beyond clustered galaxies (see below), Spiral galaxies (S) are four to five times more common than Elliptical (E); both have similar magnitude ranges, although the compact Ellipticals usually are more luminous. The Irregular (Irr) galaxies and the more abundant Dwarf Ellipticals (dE) are fainter (smaller negative numbers), so that they are hard to detect; the numbers of such dwarfs have almost certainly been underestimated because of the difficulty in detecting them.
|A wedge diagram of the distribution of galaxies showing that these tend to cluster into filaments and |
The 2MASS Sky Survey program, conducted jointly by the University of Massachusetts and CalTech, is plotting the location of galaxies observed in infrared light over the entire sky (both hemispheres). It has published maps of galaxies out to ever increasing distance from Earth, including this plot of galaxies out to 500 million light years from Earth:
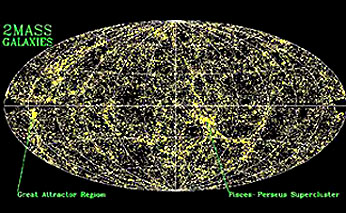
In March of 2003 the 2Mass team released a “completed” survey of the entire sky out to the farthest reaches detected. Here is their map in which closer galaxies are in blue and the farthest in red (there is a dark area in the central part that represents the location of the Milky Way, after its star contribution had been subtracted). In making this color version, the 2.2 µm band = red; 1.6 µm = green; 1.2 µm = blue. Thus, in this rendition a sense of 3-D distance out towards the cosmic horizon is given by the color scheme: closer in is blue, intermediate is green, and the more distant galaxies are red.

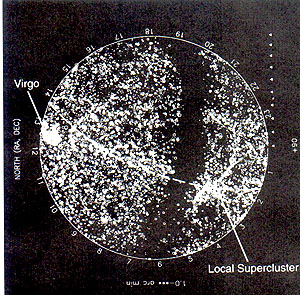
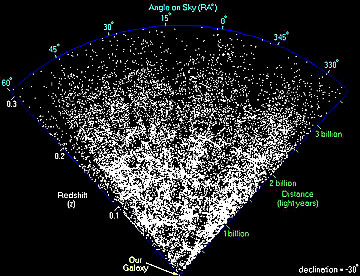
In mid-2000 preliminary results of a more extensive count (~106,000) of galaxy distribution with distance in two slices of the celestial sphere (each about 75° across, 8 - 15° thick, and out to ~ 4 billion light years from Earth) was announced at the annual American Astronomical Union (AAU) meeting. This is the map presented there:

At first glance, the distribution is a bit illusory. At ever farther distances, this map seems to indicate a decrease in the numbers of galaxies, which defies the Cosmological Principle which says that the Universe appears to be isotropic and homogeneous at large scales. But, remember that current detectability decreases with increasing distances. And, perhaps also, the number of galaxies has been increasing with time so that closer to Earth, where one sees younger and younger events (light has not traveled as far and thus represents later departure from the source), there are newer galaxies added to those formed earlier than 4 billion years. The clusters of voids and filaments is masked somewhat at this scale owing to the large numbers involved, but this structure still persists when the map is examined in a large sheet. The structure is less evident when only galaxies close to the Milky Way are depicted, as in this image which includes galaxies at distances less than 1 billion light years.
From Astronomica.org
The largest Sky survey to date uses the APM (Automatic Plate Measurement) technique to image galaxies betwee Magnitude 17 to 22. Here is a composite made by the University of Nottingham that contains at least 2 million galaxies over a 100° portion of the sky outward from the Earth’s South Pole. Individual galaxies can be resolved in enlargements but in this rendition the sky seems filled with galaxies (most rendered in red, indicating smaller size.

A website that lists many of the ongoing surveys of the distribution of galaxies and other large objects beyond the Milky Way is accessed by clicking on Sky surveys.
This strong tendency for galaxies to cluster into linear or planar arrangements may owe its origin to the early moments of the Big Bang. Gravitational waves and/or other processes may have concentrated energy and mass in thin tubelike patterns called cosmic strings that extended for millions of light years in various directions within the growing Universe. Because of their higher densities, the strings served to attract and draw in matter that eventually organized into centers of star formation that developed into galaxies located around these narrow lines of stronger gravity. Proof of the existence of cosmic strings is still speculative. Cluster sheets like the “Great Wall” that intersect other sheets produce Superclusters in a honeycomb-like network with dimensions exceeding 100 million light years (See the Virgo Cluster illustration on this page for another typical example).
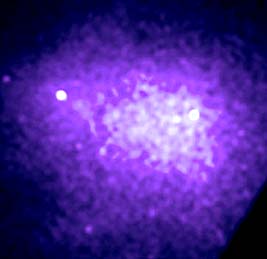
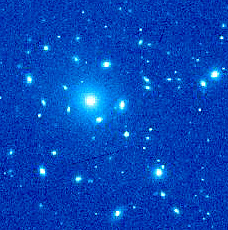
Another type of galactic clustering produces huge globular concentrations. The Coma Cluster is a grouping of thousands of individual galaxies in a loosely spherical spatial distribution that is 1.5 million light years across. An x-ray image made by the orbiting Chandra telescope (see next page) shows this clustering. Between galaxies is low density intergalactic gas (mainly hydrogen) whose kinetic temperatures reach one million degrees Kelvin. Lower temperature clouds also can be discerned; these may eventually form new galaxies.
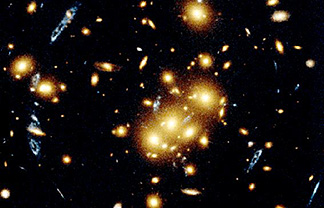
This next Hubble image shows the region called c10024+1654, again noted for the various galaxies lying at that distance (about 5 million light years). The number here is small but galaxy clusters can contain a thousand or more individual members.
The Hubble Space Telescope has greatly increased the number of galaxies that can now actually be seen; cataloging of a significant fraction of the new HST individuals in the northern celestial hemisphere is underway and more detailed observations in the southern hemisphere have been initiated. But, because of the huge numbers involved, only estimates of the total can be made by sampling segments of the observable Universe and then extrapolating throughout the celestial sphere encompassing the Earth. Thus, an unsophisticated (lower limit) guess at the total number of stars in our Universe can be set forth as the product of the approximately 10 billion (10:sup:10) galaxies times the number of stars contained in typical galaxies (another 1011) or at least 1021 stars. However, be advised that the outer reaches of the observable Universe have yet to be seen, if indeed one can imagine such limits (there is no proof or reasonable assumption that demands the Universe to be bounded or finite).
Returning close to “home”, the Solar System is embedded in a spiral galaxy (our star, the Sun, born about 5 b.y. ago, is positioned just over 1/2 out [about 27000 light years] from the galactic center which lies visually within the constellation Sagittarius as a backdrop). As seen from Earth the rest of the galaxy, with its high density of nearby stars (closest to the Sun is Alpha Centauri, 4.2 l.y. away; see image on page 20-5), is named colloquially the “Milky Way” (because the disc in which we are embedded resembles a diffuse “milk”-like band across the night sky). Age estimates for the Milky Way’s inception fall around 10 billion years. Like most spiral galaxies, the bulk of the stars occurs within the spiral disc, with the maximum number in the central region. But lower numbers are found in a “halo” that extends above and below the disc. These are tied gravitationally to the galaxy (which itself maintains its integrity of motion - and stays together - owing to a great deal of mass, most of it invisible or non-luminous).
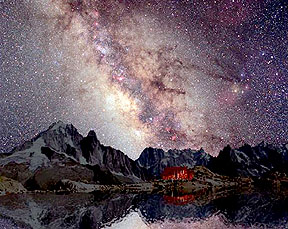
Most of what we think we know about other galaxies and star behavior in the galaxies beyond comes from studies of our host galaxies. Because of its proximity - actually the Sun is within it - astronomers have obtained exceptional photos and images of the entire Milky Way. This one is spectacular. It was made by Sylvestre Lacblanc using a camera that took a continuous color-filtered photo for 40 minutes, keeping the camera moving in accord with the Earth’s rotation. Taken in the Swiss Alps, he combined the celestial photo with a nighttime photo of the nearby mountains.
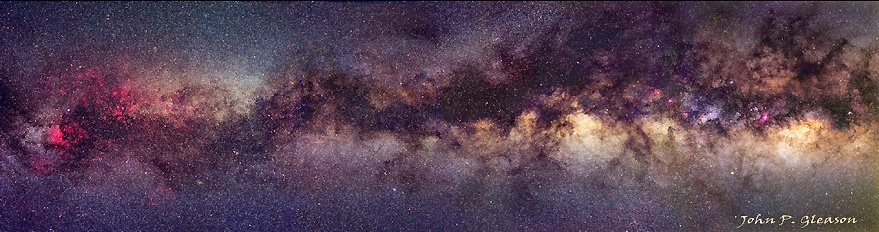
To photograph other parts of the Milky Way, the observation must be made from the Southern Hemisphere. Here is a long segment of the M.W. seen from Africa in a photo taken by John Gleason.
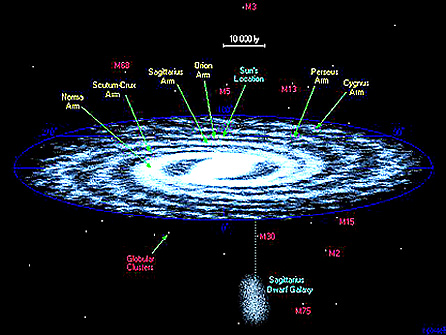
The several spiral arms of the Milky Way have been named. This is an artist’s painting of the Milky Way, with the Sun and several other named stars located within their respective arms:
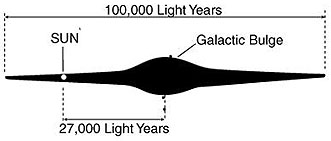
The location of the Sun is indicated in this generalized side view:
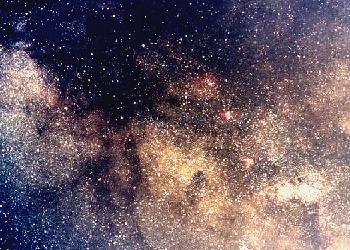
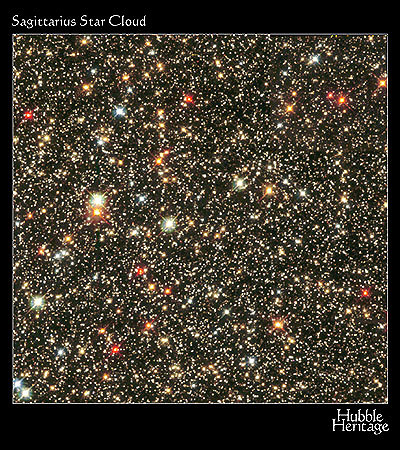
As seen through a 16 inch telescope, a part of the Milky Way cutting across the constellation Sagittarius is shown to consist of many stars mixed with gaseous clouds:
A large part of the Milky Way is imaged in this infrared view obtained by the COBE (Cosmic Background Explorer) satellite (described on page 20-9).
The number of stars (of all sizes and states) in the Milky Way approaches at least 100 billion and may be as much as 300 billion. One star has now been accurately dated to be about 12 billion years old, meaning that the M.W. formed early during the 2 billion year interval in which most of the galaxies organized. A recent image of just a tiny segment (13 light years wide) near the center of the Milky Way (in the vicinity of the Sagittarius constellation) was obtained by the Hubble Space Telescope (see below), as seen here, with some of the individual stars being Red and Blue Giants (see page 20-5).
A somewhat different perspective on the core region is afforded by this optical telescope (the 8.2 meter VLT YEPUN) image, in which the two close-spaced yellow arrows point to the Sagittarius-A region which appears to be the M.W. center, at which evidence grows that a Black Hole exists there (see also page 20-5 for a radio telescope image of the immediate central region). Hot stars are blue, cooler red; clouds of dust show up as diffuse red areas.
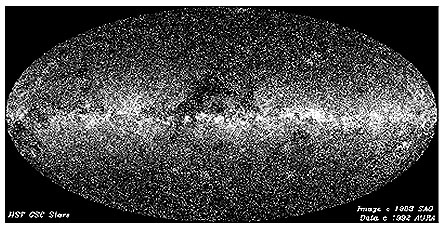
On a grander scale, HST has imaged both the Milky Way’s spiral disk and the myriad of stars that surround it as a halo. Thus:
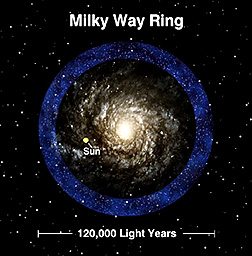
An announcement made on January 6, 2003 at the annual meeting of the American Astronomical Society tells of a new discovery about our galaxy. Just beyond the spiral arms of the M.W. evidence has been found for a ring (distinct from the halo) of about 500 million stars, in a denser concentration than its surroundings. Actually, observers have so far found only segments of this still not fully observed ring and are now engaged in searching for the remaining segments if this is indeed a ring. Still so new that speculation abounds, theorists have considered this evidence of remnants from an earlier collision with another, smaller galaxy. Here is the artist’s conception of the ring, part of a press release from the AAS meeting (note the strong similarity to Hoag’s Object, shown on the previous page as an actual HST image):
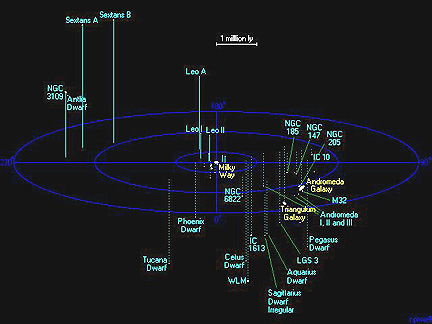
Our galaxy is part of the Local Group (20 galaxies). The closest (to the Milky Way) neighboring spiral galaxy, Andromeda, located about 225,000 l.y. distant from Earth. Here is an HST view of this galaxy which is slightly larger than the Milky Way:

The same astronomers who reported the ring of stars around the Milky Way claim they can make out a possibly similar ring around Andromeda.
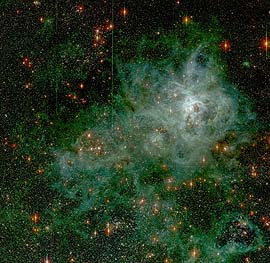
Much closer are two irregular satellite galaxies - the Large and Small Magellanic clouds - that are about 50 Kpc (16,300 light years) away. These galaxies (among the dwarf group) are part of the Local Cluster and are themselves orbiting the Milky Way. A HST view of the Large Magellanic Cloud is shown here; note that it is more a small nebular mass than a distinct galaxy. Because of the irregularity of the arms (not in a spiral configuration) the LMC is also known as the Tarantula Galaxy.
Beyond the Local Group is the nearby (60 million light years away) Virgo Supercluster (containing about 250 large galaxies and up to 2000 smaller ones); the individual galaxies in this broad grouping are moving (separating) relative to each other as space itself expands. However, these clusters and a large number of other galaxies (e.g., Centaurus) in this region of the Universe, when their general directions of movements are plotted as vectors, appear to be converging on a center of mass (colloquially referred to as the “Great Attractor”) which may itself define superclustering on an even larger scale. The three-dimensional appearance of the Virgo Supercluster can be visualized with the aid of this artist’s rendition, which attempts to show how galaxies and galaxy clusters tend to be arranged in long filamentous “strings”:
It is practical to display stars close to the Sun and within our galaxy, and named or numbered galaxies themselves in a series of drawings and plots that better illustrate astronomers’ conception of the large scale structure of galaxies throughout the Universe. This type of plot can be seen at Jerry Pool’s An Observation of the Night Sky. Fourteen such maps, beginning with stars within 12 light years of the Sun and ending in deepest space, are accessible at this Internet site. Some of the plots are reproduced here, after downloading and improving their display characteristics (in resizing, the print tends to become poorly legible). Others that download as too large to display after reduction in size can be checked out at Pool’s site, which retain legibility for all maps.
The first drawing shows only stars, out to a distance of 12 light years:
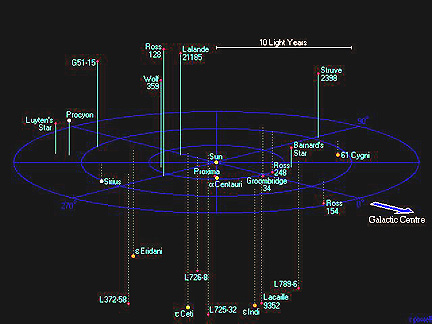
The next plot carries out to 20 light years:
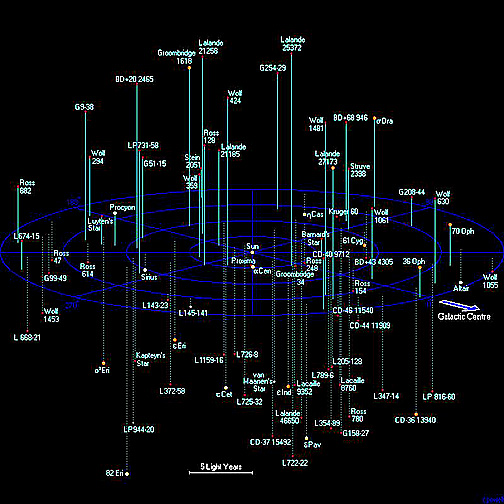
The third map, extending to 250 light years, still contains only stars in our neighborhood in the Milky Way Galaxy.

Now we move out of the galaxy to show what is known as the Local Group:
This next group contains the Virgo Cluster (found in the constellation that includes the star Virgo):
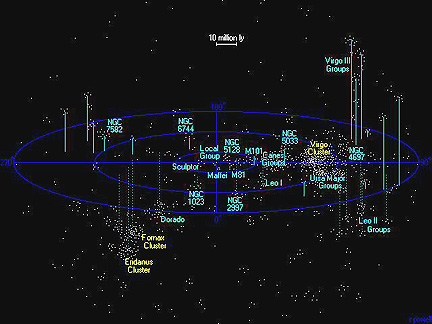
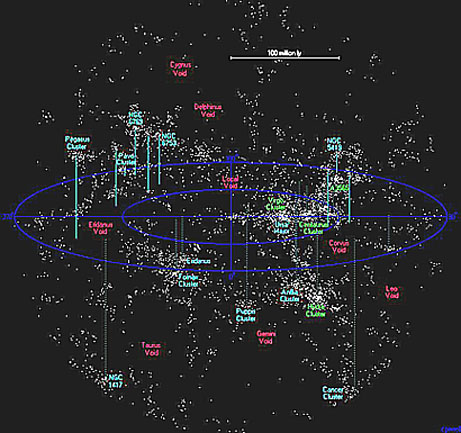
This (somewhat blurred) map identifies galaxies and galaxy clusters across a field of view 400 million years across.
We jump now to a map that carries out to 1,000,000,000 light years which includes the supercluster the Milky Way lies within:

The last map is a flattened view to 2 billion light years from Earth. Both filament clusters and individual superclusters are shown; many have been named:
|Superclustering out to 2 billion l.y. |
Results of a survey made by the UMass sky project (this, like the figure above, is not a photo or image, but is a plot constructed from computer data of the objects surveyed) of part of the sky out to about 4 billion light years appear in this plot:
Note the strings associated with galaxy clusters. The number of galaxies appears to diminish notably with increasing distance. This is illusory and is caused by the inability to detect many of the fainter galaxies that are farther out.
What is the fate (“death”) of a galaxy? While individual stars may “disappear” through loss of luminosity (see page 20-6), their “corpses” - neutron stars and black holes” remain. There is no evidence that galaxies are destroyed, although some lose their identity if they merge or collide with another galaxy. Since the beginning of galaxy formation, these stellar aggregates have been moving apart at rates that have varied with time. The ultimate fate of all galaxies as they continue to separate is that their smaller stars will finally die as they burn up their nuclear fuels, and there is insufficient hydrogen available within or near them to form significant number of new stars. Estimates of when this will occur generally place this burn-out as at least 50 billion years in the future, and some cosmologists argue for even longer periods of continued galactic survival.
Several comments about galaxy ages: The majority we can detect through telescopes or other instruments are old - the bulk having begun to organize in the first billion years of the Universe as protogalaxies. Well-formed galaxies had evolved by 2 billion years and these were fully matured by 8 to 9 billion years ago. Yet, when we look out into space (and back into time), the oldest-appearing are near Earth and the youngest farthest away, even though the majority may have developed early. This paradox is illusive - caused by travel distances of light to Earth from galaxies at different parts of an expanding Universe - the rule is that the farther away a galaxy is from our observation point, the longer (greater time) light has taken to reach us and, as a corollary, the earlier is the stage of development of the more distant galaxies. This is treated in detail on pages 20-8 through 20-10. However, within any given galaxy, its component stars have a wide range of ages - some were destroyed long ago, some have survived from the youthful stages of a galaxy’s history, and some have formed or are forming in recent cosmic history.
The Hubble Telescope is capable of looking through observable space to the outer fringes of the observable Universe. Galaxies far out would be too faint to be seen during the usual exposure times. Thus, the HST scientists have initiated the *Deep Field* program to try to obtain images of the more distant galaxies. This involves multiple observing sessions that provide repeated exposures through the Wide Field Camera of the same narrow segments of the celestial sphere, so that the superimposed images are additive in photon energy received. Many Deep Field views have been made, of which the one below is typical. However, most of the galaxies in this image are not in the farther regions of space. Galaxies ranging from close in to far out are included in the conical segment of the observed sky. The farthest generally appear as small shapeless objects that are faint to moderately bright (in a few views some can be separately with limited certainty into spirals or ellipticals). What one is also seeing in such a Deep Field image is also a time distribution of the galaxies (see previous paragraph): better defined galaxies are larger, more structured, and appear as they were at the cosmic time when light left them where/when located then in the expanding sphere of galaxies; these are also in more advanced stages of development; the fainter, more distant galaxies appear in the image at younger stages of development .
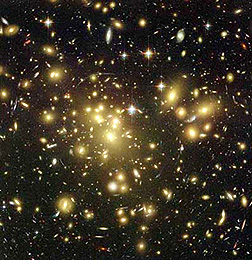
One of the best Deep Field images obtained to date was made by the Advanced Camera for Surveys (ACS) on the HST. This camera, peering through the Abell galaxy, has picked up many distant galaxies, several of which may be 13-14 billion l.y. away, and hence less than 2 billion years old. Note the gravitational lensing (arcs) associated with several of the galactic objects.
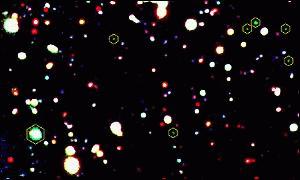
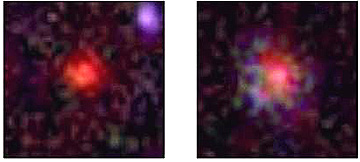
In this next Deep Field view, two red dots in the enlarged inset (see main image for outline) are early Universe galaxies as they appeared at approximately 13.6 billion (light) years before the present. These are among the most distant from Earth found to date.
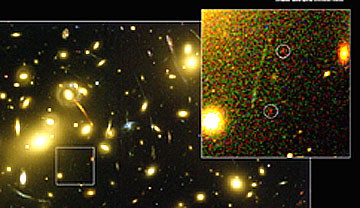
In all these Deep Field images the galaxies identified as very far way (using mostly redshift measurements to gauge distances; see page 20-9) and appear very small compared with images of galaxies we have already seen. Some of the properties of the Deep Field types can be determined but much important data are not obtained owing to the low resolution which prevents measurements of important defining information. Thus, there is uncertainty about the general galaxy types, distribution of stars, galactic structure, etc. that will have to await the Next Generation Telescope (see page 20-2).
The Deep Field Program has been supplanted by the GOODS [Great Observatories Origins Deep Survey]) program. This program looks at two much larger segments of the sky (60 times the area of the celestial sphere that was looked at by the DFP), one in the northern celestial hemisphere, the other in the southern hemisphere. The participating Observatories are the Hubble Space Telescope and the Chandra X-ray Observatory (together with some data from the Compton X-Ray Observatory). They will be joined by the Space Infrared Telescope Facility (SIRTF), scheduled for launch in August of 2003. The spots in the sky segments surveyed that show distant galaxies in each Observatory panorama will be co-registered to synergize their interpretations. An overview of this program is accessed on the Net at GOODS.
This GOODS view, made by the ACS on HST, shows a much wider field of view in which most of the small “points of light” are Deep Field galaxies lying from 10 to 12 billion light years from Earth.
Chandra, not to be outdone by its Hubble partner among the Great Observatories, has produced its own Deep Field view. Here then is the x-ray version of very distant galaxies in the outer regions of the Universe:
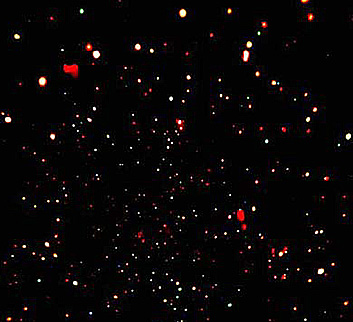
In both these images, larger galaxies are closer; the distant ones are mostly Deep Field candidates.
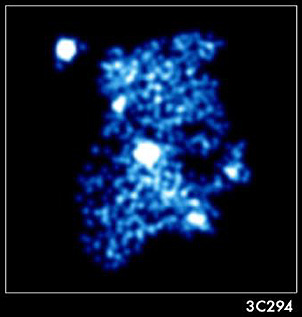
Chandra has provided some detailed images that further our insights into galaxy formation. Consider this view of Galaxy 3C294, located about 12 billion l.y. away, and hence seen now as it was some 2.5 billion years after the Big Bang.
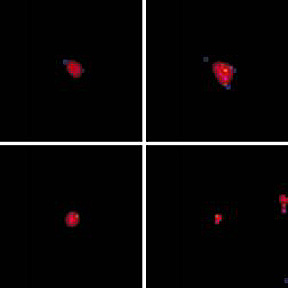
An example of the current ambiguities (perhaps solvable only with the NGST and other more powerful and sensitive telescopes of the future) appears in this quartet of red objects extracted from HST Deep Field images. Astronomer Kenneth Lanzetta believes these to be now faint galaxies as far away as 13.2 billion light years, with their color to be that expected from the redshifts at that distance. But an alternative explanation is that they are closer and are composed of stars now dominated by those with luminosities that shine in the visible red.
Some of the material now considered on this, and several other Cosmology pages, has been gleaned from a highly recommended review article entitlted “The Life Cycle of Galaxies”, by G. Kauffmann and F. van den Bosch, in the June 2002 issue of Scientific American. They describe a model, growing in acceptance but still provisional and unproved, that gives Cold Dark Matter (CDM) a key role in the evolution of galaxies. We will summarize it here, but consult their article for details:
At the Big Bang and for a time thereafter, the rapidly expanding Universe consisted of baryons and other ordinary matter and CDM, undifferentiated in space (i.e., mixed). Initially, expansion overcame the effects of gravity but as will be shown on page 20-9 there were local slight fluctuations in density of both kinds of matter. These thinned out less that the more uniform general distribution of matter and radiation during expansion. The denser patches (initially irregular in shape) attracted nearby matter until their gravity exceeded the effects of that expansion and they began to collapse. The CDM and ordinary matter (baryon-rich) attained a mutual equilibrium, with the density of both kinds maximum in the center and decreasing outwards. As the collapsing continues, the dark matter separates from the baryons and remains primarily in the halo region. Ordinary matter, primarily as gas, even before it starts to organize into stars, radiates energy outwards as its particles interact by collision; in doing so it loses some of the energy that earlier counteracted gravity and begins to collect in small regions overly dense compared with their surroundings. The weakly interactive CDM, however, does not collide and does not radiate its energy as photons into space but does retain its gravitational influence on the patch.
The dark matter remains in its roughly spherical concentration, becoming the dominant material in the Dark Halo (containing both CDM and some ordinary matter) that many astronomers now consider to be the controlling part (through gravitational influence) of protogalaxies as well as subsequent normal ones. Ordinary matter settles toward the central interior of the halo sphere until it configures through self-gravitation into a rotating disk. This rotation is generated by transfer of angular momentum as neighboring (and in the early Universe, closer-spaced) protogalaxies exert forces on each other. Individual protogalaxies influence others nearby, exerting torque forces that induce spinning. Some of the protogalaxies (in particular the smallest ones that have the highest densities) meet each other and merge their star populations into elliptical galaxies. Those that don’t interact directly, but grow large enough, tend to flatten into disks that become the spirals; in these, there develops an equilibrium between centrifugal forces from the spin and inward-acting gravitational forces that permits maintenance of the spiral arms. Others that do not enlarge significantly make up the dwarf galaxies or the irregular galaxies described above. Such galaxies probably experienced minimal (or no) collisions. Within each halo patch giving rise to a protogalaxy, gas and dust condense into individual stars. Where gas densities are high enough, the stars form at a ‘frenzied’ rate (these comprise the “starburst” galaxies).
The end result of the separation process which gives rise to a galaxy and its halo is the attainment of two kinds of equilibrium: hydrostatic, for the galaxies, which maintains a balance between gravitational and thermal plus radiative forces (however gravity varies inwardly towards the center); virial, for the surrounding halo, in which (time-averaged) kinetic energy K is balanced with respect to gravitational potential energy according to the virial theorem (K = -1/2G) (gravitational field associated with dark matter does not fluctuate.
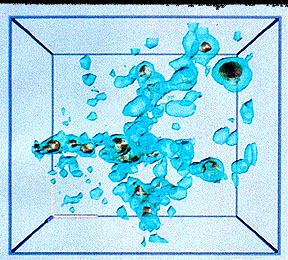
As interpreted by Andrew Fabian of Cambridge University and his colleagues, galaxies such as this form by huge clouds of gas organizing into many small galaxies that continue to grow. Their history may be controlled by a supermassive black hole that helps to organize these galaxies into a larger unit. The blue areas in the above image are galactic gas concentrations giving off strong x-rays (and radio waves). Jets are involved in maintaining high energy levels which help to keep galactic matter from disappearing into the black hole. Over time some of this inflow happens and the galactic growth reaches an equilibrium, slowing the galaxy formation process to a near halt. Eventually, as more galactic gas is heated up the organizational process repeats and galactic growth recycles one or more times until the current (final?) galactic unit is stablized. This process may be a controlling factor in the development of clusters of galaxies.
This notion that large galaxies develop by the merger over time of ten to perhaps 100 small satellite galaxies has been gaining acceptance in recent years. Researchers are designing a test, RAVE (RAdial Velocity Experiment), to study the proper motions of small galaxies around a central galaxy to determine if this process is going on and is common. Initially, the Milky Way will play that central role as small clusters approaching galaxy-size in the halo are examined for their motions with respect to the M.W.
There are two competing views as to which type of large galaxy forms first. There is general agreement that protogalaxies preceded Spiral and Elliptical Galaxies; some may still persist and may comprise some of the Irregular types. Dwarf galaxies and Globular clusters also were early members of the hierarchy of galactic types. Many hold that the dominant first galaxies were spirals. In this view, elliptical galaxies were developed mainly from collisions of spirals. Other opinions favor elliptical galaxies (with their pre-eminent old stars) were the primordial type, at least those which may constitute AGN’s in spirals, but most of these subsequently captured gases that organized in the stars occupying the arms that characterize Spiral Galaxies.
This question of which came first (if indeed it proves out that one type preceded the other) was in a sense answered by images (that include an IR band) taken by the European Southern Observatory (ESO) telescope that has acquired the best yet images of galaxies determined (by distance measurements) to have formed in the observed state only about 2 billion years after the Big Bang. The majority of the few so far imaged by the ESO telescope are apparently elliptical. But among the group is at least one that appears to be evolving into a spiral. Thus:
In terms of evolutionary trends, in the first half of cosmic time the morphology of galaxies was less well developed (larger number of irregular/peculiar types), with spiral arms less organized and barred spirals quite uncommon. The appearance and maturity of the various types in the Hubble classification of larger galaxies may have been reached only in the last 4 billon years.
Deep field observations and other sources of information (much derived from have led astronomers to conclude that galaxy formaton rates were much higher in the first 6 billion years of Universe time and since than have been slowing to a present estimated 10% of the maximum in the first few billion years.
To supplement the above interpretive remarks, here is the gist of a press release made when the first major results of the GOODS survey were presented in June of 2003: Galaxies began to form in the first half of the first billion years after the Big Bang. It is hypothesized that they developed in regions where dark matter (see page 20-9) was denser (mature galaxies also contain an excess of dark matter) and thus preferentially attracted the hydrogen gases formed soon after the Big Bang. Those galaxies that started in these early eons tended to be irregular in shape and to contain a high number of massive stars. These stars burned out rapidly and exploded by the supernova/hypernova processes (page 20-6) that expelled materials throughout the protogalaxies, thus assuring that the galaxy shapes remained distorted by the high velocity ejections of matter that inhibited galactic dvelopment into regular types. Since the Universe’s size was still small during this first billion years, these “wispy” galaxies stood a higher chance of enlarging by collisions and accretion. In time, then, the rate of new galaxy formation started to decrease and the number of galaxies may have actually diminished by “consolidation”. As disruptive explosions and their attendant shock waves became less frequent with the decrease in giant star formation, the galaxies stabilized into the more orderly spiral types and ellipticals that now dominate the galactic Universe.
But, lest there be a misconception that all galaxies came into being early, there is little doubt that galaxies can form well after the principal period of development in the first few billions of years after the B.B. This view made by the Hubble Space Telescope shows POX189, a galaxy 68 million l.y. away, seemingly in the throws of organizing its gas and dust into what appears will become a spiral type. Only 900 light years in diameter, but with about 10 million years stars, this proto-galaxy is estimated to have begun organizing about 100 million years ago, perhaps through a collision of two nebular masses.

Finally, an informative review of galaxy formation, which ties nicely into the above treatment of this topic, can be found at this PhysicsWorld Web site.