The Magellan Program
Contents
One of the most productive probes ever launched, JPL�s Magellan was launched in 1989 and arrived to orbit around Venus in 1990. Its primary sensor was an imaging radar that over time provided views of nearly the entire surface at resolutions ranging between 120 and 360 m. It also could map elevations to +/- 50 meters and had a radiometer that determined brightness temperatures to +/- 20� K. This page elaborates on these general properties and shows some full views of Venus and a Venus surface map.
The Magellan Program
Magellan’s primary instrument was a multimode Radar Mapper (2.385 Ghz, or 12.6 cm wavelength). In the SAR imaging mode, looking between 18° and 50° off-nadir, it could capture scenes with resolutions between 360 m and 120 m (1181-394 ft), depending on its position within its elliptical, near-polar orbit (at altitudes between 275 and 8,443 km (171 to 5,246 mi above a mean venusian radius of 6,051 km [3,760 mi] ). It first established orbit on August 10, 1990 after 1 1/2 loops around the Sun. Its altimeter mode achieved a vertical accuracy of better than 50 m (164 ft) within a ground cell of 10 km (6.2 mi) diameter. Operating in a radiometer mode, the radar could sense surface radio-emission, whose signals can be converted to brightness temperatures with an absolute accuracy of ±20° K. Investigators gleaned information on mass distribution (causing gravitational anomalies) from Doppler frequency variations due to gravity effects that varied orbital speeds. Even as Venus rotated slowly beneath (one complete day every 243 Earth days), during stages of its orbit closer to the planet, the radar imaged surface swaths between 17 and 28 km (10.6-17.4 mi) wide. Through the first cycle lasting 8 months, it mapped 84% of the surface. In the next 16 months, that percentage rose to 98%. Additional coverage provided repeat looks in search for possible transient or short-term changes. After several adjustments to lower orbits, the spacecraft finally burned up in the venusian atmosphere, in mid-October, 1994.
Image strips covering thousands of kilometers, especially after being joined as mosaics, provide stunning views of a fascinating venusian surface that is still undergoing thoughtful interpretations. Although Venus no doubt formed concurrently with Earth, its surface today is largely younger than one half billion years (Earth has some surficial regions older than 2 billion years). Planetologists base this estimate on venusian crater frequencies. Even though not uncommon, the numbers of resolvable impact structures are consistent with 1) destruction of the much larger numbers from the first 4 billion years, most probably by active processes that removed them by lava overplating (resurfacing) and by still arcane erosional actions, and 2) asteroidal flux rates for the last 5 hundred million years, in line with estimates from other planetary surfaces. Effects of volcanism are conspicuous, with thousands of small volcanoes detected, along with many lava channels. Although fracture zones and sets of close-spaced ridges are evident, no direct indications of terrestrial-like plate tectonics are discernible. Surface water, if ever present, left no signs of stream or ocean activities, and would have escaped from the planet (traces are present in its atmosphere) as Venus heated up, until a massive “runaway greenhouse” warming effect overwhelmed the planet. The slowly rotating atmosphere seems to have caused some wind streaks and dune-like deposits on the surface.
The gallery of Magellan images is vast. We show only a select few here but you can access more at JPL’s Magellan Home Page (http://www.jpl.nasa.gov/magellan/).
To familiarize you with some of the major features and their locations on Mars, look at this shadowed relief map of the non-polar regions of the planet with the key geomorphic features labelled, as prepared by the U.S. Geological Survey:
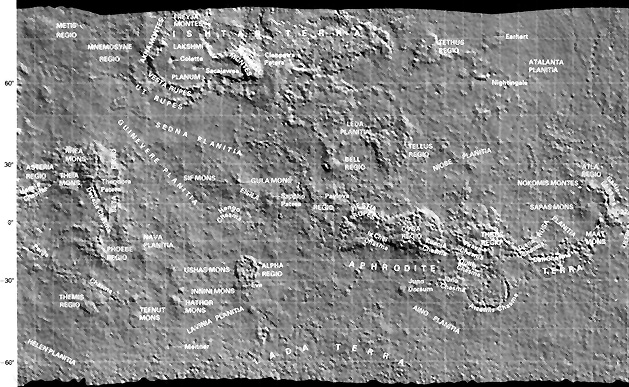
Next, consider this color-coded relief map of nearly all of Venus, on a Mercator-like projection, derived by integrating imaging and altimeter data.
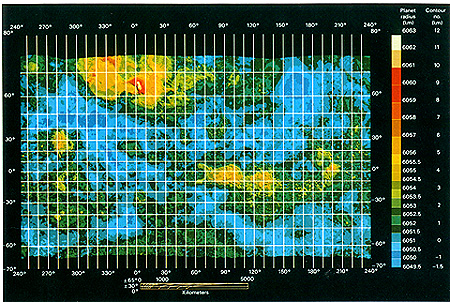
Blues represent the lowest surfaces followed by greens, then yellows and oranges with red being highest. The greatest elevations are within Maxwell Montes (top left), that includes the high point of the uplands known as Ishtar Terra. Another high region, near the equatorial center, is called Aphrodite Terra. Beta Regio, near the central left, is also elevated. Two blue regions in the north are low plains, called Sedna Planitia, below Ishtar, and Atalanta Planitia, well to its east. A large curved channel south of Aphrodite is known as Artemis Chasma.
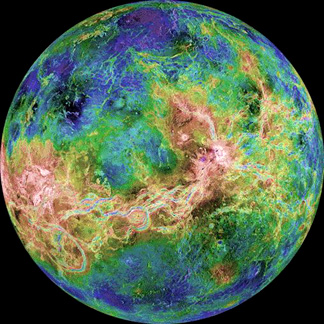
Now look at a hemispherical projection that lies within this full map. Try to identify the high central region (in pink); refer to the first relief map above (hint: think of a lovely goddess).
Here is a second Magellan topographic map, now centered on Venus’s North Pole. A small part of the first map is present in the second; find it.
|Another Magellan radar image of venusian topography; center is at Venus’ North Pole. |
` <>`__19-28: Try to identify the high central region (in pink), enlarged from the first map (hint: think of a lovely goddess). `ANSWER <Sect19_answers.html#19-28>`__
We can also display (below) this same hemispherical segment as a quasi-natural, color image of a mosaic of rectified Magellan scenes. There is no direct proof that Venus has this much red (the choice of assigned colors was a rather arbitrary, best guess) but, if so, the presence of oxidized iron could account for such tones. The dark, blackish low areas are presumably basalts.
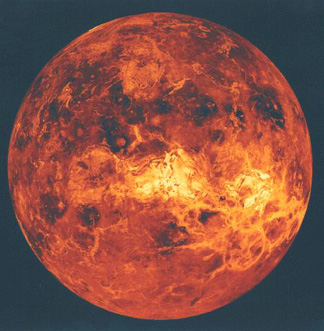
` <>`__19-29: Once again, try to orient yourself in this image relative to the shaded relief map and localities described on that map. `ANSWER <Sect19_answers.html#19-29>`__
Magellan carried a microwave experiment (managed at MIT) from which a map of thermal emissivity (see Section 8) could be derived, as shown here. Note that the lowest emissivities (in blue) are found in the highest parts of the venusian surface, implying that the rock types there were other than basalt.
|Thermal emissivity (determined by the microwave radiometer on Magellan) of the venusian surface. |
Primary Author: Nicholas M. Short, Sr. email: nmshort@nationi.net