Post-Apollo Lunar Exploration
Contents
Following the Apollo program, public interest and to a lesser extent that of planetary scientists in lunar exploration, seemed to have notably waned. One reason for this was the increasing exploration of the other planets (Mariner; Pioneer; Voyager, and other programs). However, scientific investigations of moon rocks continued unabated. In the 1990s, a renewal of scientific interest in the Moon led to NASA programs to return there with orbiting spacecraft that extended instrumental analysis to the entire surface. Results of the Clementine and Lunar Prospector programs are presented. Of tantallizing significance was the discovery of considerable water ice at the Moon’s South Pole, which reopens the possibilities for setting up a station or base for long term stays that would permit carrying out extended experiments. Speculative models for the origin of the Moon (now most scientists consider an impact on Earth to have been involved), some strongly supported by its exploration over the last 30 plus years, are presented.
Post-Apollo Lunar Exploration
The views presented so far highlight the two dominant characteristics of the lunar surface: 1) the mare/highlands dichotomy, and 2) the abundance of circular features, nearly all being impact craters and basins but some of probable volcanic (caldera) origin. This next scene emphasizes both characteristics by showing an exaggerated false-color image of the front side of the Moon, taken by the multispectral vidicon onboard the Galileo spacecraft (described later in this section). The highlands, with their higher reflectances, appear in shades of red and orange and the lower reflectance maria are in blues and greens.

After Apollo, the Moon was not specifically revisited for 22 years, until an unmanned spacecraft, Clementine (funded by the Department of Defense), orbited it to conduct mapping studies between February 19 and April 21, 1994, using UV/Visible, Near IR, and High Resolution Cameras, Lidar (a radar altimeter), and a radar-like unit that transmits in the S-band radio frequency (2.293 GHz, or 13.19 cm wavelength).
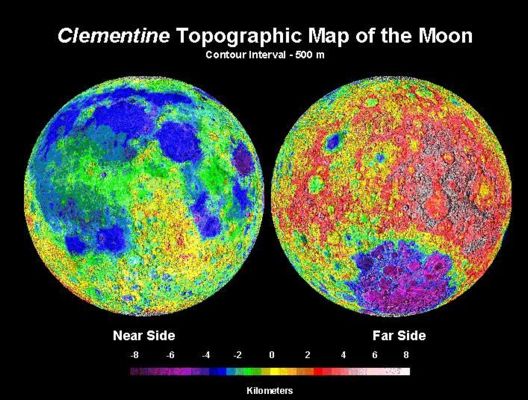
Look first at a topographic map of the front and far sides of the Moon, in which stereo data provided elevation differences from high resolution photographs and radar altimetry data, acquired by the Clementine spacecraft as it orbited the lunar surface.
As explained in the next paragraph, image data at various wavelengths can be used to map compositional differences in much the same manner as with multiband data obtained by Landsat and other terrestrial spacecraft. Below is an image of the 40 km wide crater Aristarchus that is found in the southeastern part of Oceanus Procellarum. The composite image is constructed from three ratio images (input bands in units of micrometers [µm]): 0.750/0.415 = red; 0.750/1.00 = green; 0.415/0.750 = blue. The dark gray surface is mare basalt; the reddish unit is ejecta from Aristarchus; the light blue is probably anorthositic rock (common in the highlands) exposed in the crater interior:

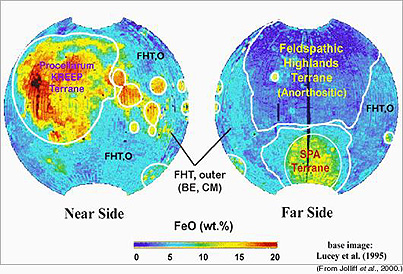
Among specialized products were more detailed maps of lunar topography (elevations) and global maps of the distribution of several chemical elements, such as iron (Fe) and titanium (Ti), determined by analyzing reflectance variations at 0.75 m m and 0.95 m m, where these elements absorb irradiation. The Fe map, reproduced below, indicates that, while iron is widespread, its maximum concentrations are in a broad region on the nearside, roughly coincident with the vast lava outpourings into Oceanus Procellarum and several other mare basins.

Clementine made a controversial discovery, which, if proved correct, has major implications for humans returning to the Moon. Its S-band radio unit detected abnormal reflections from the rim of a huge crater (basin) around the lunar South Pole, in areas permanently sheltered from the Sun’s rays, as seen in this Clementine image:
within the Aitken Basin. Traverses (in green) using a radio signal detected a lower reflectivity zone that may indicate water ice. The red areas are parts of the crater in permanent shadow, which would favor preservation of the ice.|
These reflections could be due either to water ice or to some abnormal surface roughness condition. If indeed ice is present in significant quantity, then this precious material (which supplies water needed for life and also oxygen, when broken down by electrolysis) might allow us to establish a manned base on the Moon. Transport of sufficient water and oxygen for long stays is presently beyond our technical capability.
This observation, and the intriguing results of Clementine’s compositional mapping, has led to a follow-on mission. For the first time in 25 years, NASA has returned to the Moon with a small, but versatile orbiting satellite, called Lunar Prospector. The entire mission including data analysis is another effort by NASA to achieve high scientific returns at relatively low cost (for LP, $65 million). Launched on January 6, 1998, by an Agena rocket, Prospector now is operating in a 100-km high circumlunar polar orbit, from which it can map the entire Moon over a 3-year lifetime in more detail than Clementine provided. Here is an artist’s sketch of the spacecraft:
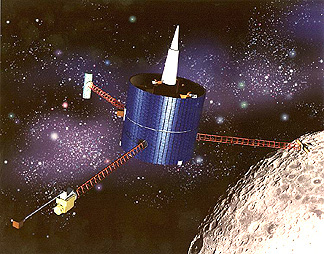
The spacecraft, just 1.4 m (4.5 ft) high and 1.2 m (4 ft) in diameter, weighing 300 kg (660 lbs), receives its power from solar cells that surround its exterior. An S-band radio sensor designed to measure lunar gravity employing a Doppler effect procedure, sits on top of a conical communications antenna (top). At the end of the 8-ft boom or mast extending to the front left, a Magnetometer/Electron Reflectometer will conduct improved measurements of the Moon’s magnetic and particle fields. At the end of the left rear mast is the Gamma Ray Spectrometer, which can detect these elements: U, Th, K, Fe, Ti, O, Si, Al, Mg, and Ca. On the right boom are the Alpha Particle Spectrometer that will measure radon gas to assess lunar radioactivity as a clue to volcanic and other current events, and the Neutron Spectrometer that will determine the presence of hydrogen and can detect water ice (its confirmation from Clementine results is a major goal).
A plot of the varying thermal neutron flux, as determined by the Neutron Spectrometer, show a wide area of low neutron counts (resulting from high neutron capture) associated with the maria on the frontside and near the North Pole and higher counts in the highlands.

Compare the distribution of Fe as determined by Lunar Prospector with the same coverage by Clementine shown above:
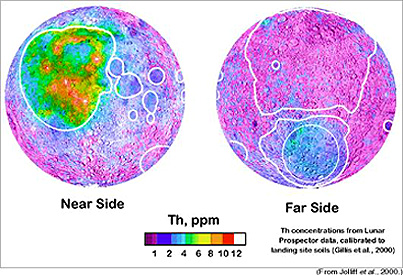
Information on the distribution of radioactivity on the lunar surface was one goal of Lunar Prospector. This map shows that the element thorium is highest on the front side of the Moon, mainly in the highlands south of Mare Imbrium. It is not clear why corresponding highland surfaces on the farside are lower.
The first results on Lunar Prospector’s detection of ice were released during an exciting press conference, held on March 5, 1998. Around both poles, the neutron spectrometer has indeed detected neutrons, released from hydrogen by natural cosmic ray bombardment of water ice in craters with sheltered shadow zones. The drop in neutrons emanating from the Moon is clearly maximal around the poles as seen in this plot.
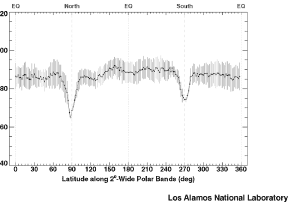
The initial estimate of the amount, to be determined more accurately with later observations, is 30 to 300 million metric tons (recent thinking has raised the upper limit to perhaps as high as 3 billion tons). If melted, this larger number would fill a “lake” 10 square kilometers in area (3.1 x 3.1 km) to a depth of 10 meters. Surprisingly, the North Pole region contains about 50% more ice than its southern counterpart. The source of the water ice is probably residues from cometary bodies that impacted the polar regions, forming craters but allowing much of the comet mass to survive embedded in the target. The implications are encouraging for future exploration of the Moon, to the extent that we can establish and occupy a manned base facility over extended time because of the availability of vital water (for consumption and as a source of hydrogen, suitable as a fuel). However, landing in polar regions is technically more difficult but doable. The dream of a permanent observation post on our satellite is now much more feasible.
More details on Lunar Prospector are given at the National Space Science Data Center Web site and the Mission Management Home Page at NASA Ames Research Center. As NASA accrues and releases data and maps, we will place them in the Web version of this Tutorial and in later CD-ROM versions.
The latest mission to the Moon is ESA’s SMART-1 spacecraft. Launched September 27, 2003 as Europe’s first venture in exploring beyond Earth, the spacecraft, using a novel electric propulsion system, will proceed slowly to the Moon with arrival near the end of 2004. This low cost satellite will orbit the Moon gathering information about surface composition.
Now, to summarize what we have learned about the Moon from nearly 40 years of space exploration:
An excellent synopsis of the major scientific information gained from, or supported by, the Apollo missions is found at this10 Top Achievements from Apollo site.
` <>`__19-23: Before you look at the site link, and based on what you have read on this page, list or mentally note what you think were the principal findings of the Apollo program? `ANSWER <Sect19_answers.html#19-23>`__
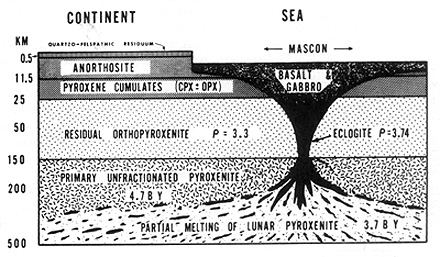
One of these top achievements is/are model(s) of the lunar interior. We close with this diagram that is one of the early popular versions (Dr. Anthony Ringwood, of Australia). By now, you should have learned enough to explain the meaning of each major layer in the outer part of the Moon (note: the quartzo-feldspathic layer at the top proxies for the felsitic rocks typified by sample 12013).
A similar but more recent model assumes the outer half of the Moon melted - forming the so-called “magma ocean” - early in its history and then underwent differentiation to produce the present general layering:
|Model of the Moon in which it melted to considerable depths (left) and then cooled and solidified the differentiated layers shown on the right; courtesy H.H. Schmitt. |
This brings us to two general topics: first, a summary of lunar evolution and then a survey of the Moon’s possible origins. The first and second topics are both included in an Internet site that considers an Apollo-based Evolution of the Moon. written by Harrison H. (“Jack”) Schmitt. Some of the ideas and illustrations from that site are used here.
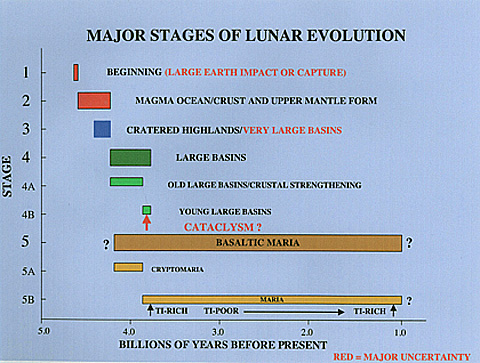
We begin the review of the Moon’s history or evolution by showing first a chart that summarizes what was known prior to Apollo:
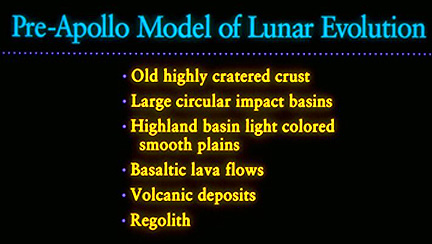
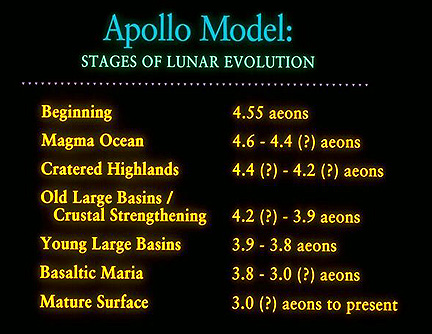
These salient points were determined both from Earth-based telescope observations and from lunar orbiters and landers. The presence of a lunar soil or regolith was confirmed by the Surveyors. The next chart encapsulates the main information on the time-marked evolution of the Moon arrived at from all sources utilizing both Apollo human observations and lunar sample analyses by Principal Investigators and other scientists:
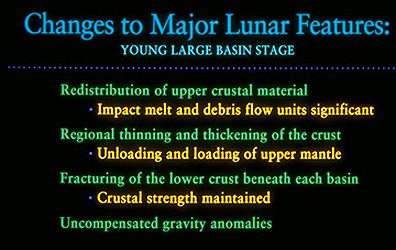
In this model, a feldspar-rich moonwide crust forms from the magma ocean. Two periods of intense bombardments by asteroids, mini-planets, and comets produce major basins which tossed materials from the highlands crust as first and then also mare surface over most of the lunar surface. These formed eventually consolidated deposits of large to small blocks and fragments making up interleaved “ejecta blankets” from 100s of meters to several kilometers thick. Off-loading and other processes mobilized subsurface rock (largely basaltic [high Fe, Mg, Ca and low Si] in composition) that melted and invaded the surface filling the maria and the interiors of larger craters. Cratering began early in lunar history, reached a maximum around 4 billion years ago, and has tapered off since. This next chart describes the changes and conditions associated with the Moon’s outer reaches at the outset of the main period of basaltic lava extrusion:
The ideas expressed in these charts can be presented in a different way, as shown in this timeline chart (again, courtesy of H.H. Schmitt):
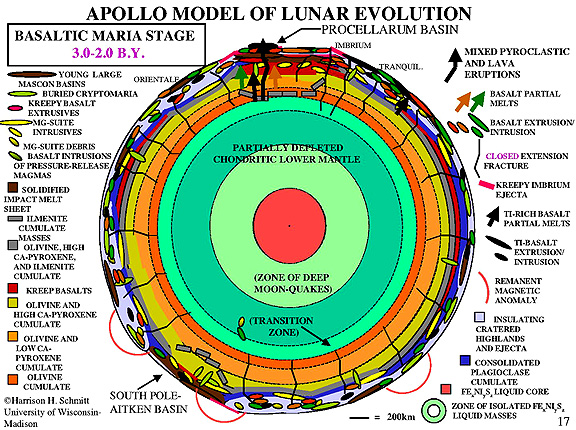
Jack Schmitt has a most interesting Internet site in which he uses various illustrations to show the progressive development of the Moon from its earliest history through the late stages of basaltic emplacement around 3 billion years ago. The site, accessed here, is in .pdf format, which requires Acrobat Reader. But, WARNING: you may experience some trouble with your computer - it tends to operate slower after signing off, or may hang up - especially if you try to print onscreen images or download them to a file. However, his figures on lunar evolution take into account much of the research done in the last 30 years, so it is worth a try to move through this site - nothing fatal occurred when the writer (NMS) went through each ..pdf page. To entice you to work through his sequence, we put up here the last (and most complicated) of his model diagrams which have added mare basalt emplacement from a period ending 2 billion years ago. By going through his Lecture 8, you will see the evolutionary steps taken to get to this stage (after which the major changes are associated with small to large impacts).
The origin (formation) of the Moon has always been a prime topic for conjecture and scientific insight among selenologists. Four main schemes for lunar origin existed before the Apollo program brought back lunar samples. One view had the Moon form from leftover debris as the Earth itself built up by aggregation. A second idea holds that debris which makes the Moon was tossed off the Earth in the latter’s early days when our planet was spinning (rotating) much faster. A third proposal claims the Moon is a captured small planet once more distant from Earth. The fourth ascribed its formation to material wrenched from the Earth’s outer crust by a massive impact leaving the Pacific Ocean Basin as a scar equivalent to a huge crater (a model that would need revision and probable discounting after the ideas of plate tectonics and continental migrations took hold).None of these hypotheses adequately explains the observed balance between the combined angular momenta of the Moon and Earth which theory indicates remains constant since the two bodies became linked. Despite its greater rotation speed in the first few hundred million years of Earth’s existence, this still is not enough to foster co-accretion. Nor is the speed sufficient to fission off the debris. But, that spin was too fast to allow capture of a passing body.
This leaves the impact model which became increasingly fashionable in the 1970s. (Before then, the writer around 1963 developed a model in which a massive impact produced a huge dent in the outer Earth but the Moon itself came [at least partly] from debris spalled off the Earth’s opposite side by the internal shock waves reverting to rarefactions that caused material there to split off and be hurled into space, thereafter accreting as the Moon. I abandoned this idea for two reasons: 1. I could not entice a colleague who knew the appropriate math to help me with the sophisticated calculations needed to prove this hypothesis; and 2. my own calculations hinted that the energy of spallation from an impact not so large as to destroy Earth was insufficient by several orders of magnitude. I also conjectured that this direct impact could have broken the [smaller] protoearth into pieces, most of which reorganized as the Earth but some formed a second body kept in tow by gravity).
By the 1970s, with the Apollo data now in hand, impact had gained favor as an integral part of lunar formation. Several impact models has since been proposed. All are constricted by the two Apollo observations that the Moon is deficient in iron (no, or a small, iron core) and by the low percentages of the volatile elements sodium and potassium. That the Moon was derived from an impact of giant magnitude on the early Earth is supported by the strong similarity in oxygen isotope compositions in the two planetary bodies. The first model was developed by scientists associated with Harvard University. But, their head-on collision model has since come up with energy and compositional problems. The most recent variation on the general impact model is illustrated by the succession of steps shown in this diagram which is the result of a computer simulation of a huge impact into the protoEarth but oriented at that moment so as to glance against or sideswipe the outer layers of an Earth whose crust had not yet fully developed. Look at this computer simulation of such an event:
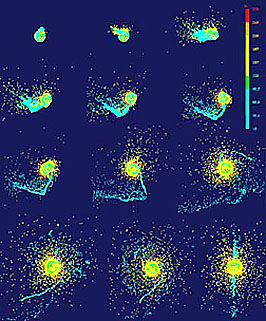
The model and some variants, collaboratively developed by scientists at the Southwest Research Institute (William Ward and Robin Canup; others) and the University of Arizona (A.G.W. Cameron, Jay Melosh, William Hartmann; others), considers the impact to have occurred late in the formational history of the Earth, but probably prior to the differentiation that formed an early terrestrial crust. At this time, a part, perhaps much, of the outer Earth may have been molten.A Mars-sized asteroid or small planet (about 10% of the present terrestrial mass) struck the Earth at a glancing angle. Although the Earth survived total disruption, much of the outer shell on one side was tossed into space, but held to the Earth by its larger gravity. The fragments in the ejecta plume are affected by rotational forces from Earth and within 24 hours have organized into a near circular orbit. In time these fragments (whose composition mirrors that of the primitive Earth) began to collide until the Moon was built up to its present size, large enough for it to have melted and reshaped into a sphere, developing an anorthositic crust. The Earth, still forming, healed its “wound”, resumed during subsequent remelting into a near-sphere, and went on to fully differentiate into the crust, mantle, and core that has survived to the present day.
The advantages of the swiping impact model are these: 1) a proper relation between Earth-Moon angular momentum comes out of the calculations; 2) the high heat of such an event boils off all water and some of the volatile elements sodium and potassium; 3) the similarity of refractory element composition between Earth and its satellite is explained; 4) only the outer mantle and any early crust are involved; 5) temperatures in a glancing event would have been higher (up to 18000° K); 6) a larger fraction of the Earth target would be ejected into orbit; 7) differences in composition could be due to incorporation of some of the impactor body, which likely varied somewhat from Earth.
The resulting Moon may have been much closer to Earth, perhaps as near as 29000 km (18000 miles). This first Moon would have appeared to occupy much more of the sky than today. It is now known that the Moon is receding at a rate of about 2.4 cm/year (around an inch), to its present average distance from Earth’s center of 384000 km (240000 miles). Extrapolating back in time for 4.5 billion years yields this early proximity value (which, however, may exceed the Roche Limit - the closest distance two large planetary bodies can be without one at least being disrupted).
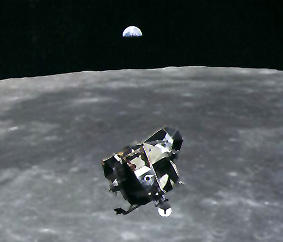
To close this subsection, there are literally thousands of informative and often exotic images of the Moon, taken by various remote sensors. Perhaps none can better convey the human emotions of having triumphantly landed astronauts on the Moon than this heart-throbbing photo taken by Michael Collins from the CSM of the about-to-dock LM containing Neil Armstrong and Edwin “Buzz” Aldrin, with Mother Earth looking so distant in the background, yet as history shows returned to successfully by these intrepid Apollo 11 explorers and ten others who set foot on the Moon’s surface (watched over by five comrades in orbit) in subsequent missions:
Two very readable popular accounts of lunar exploration are The Moon Book by Bevan M. French, 1977, Penquin Books, and Lunar Science: A Post Apollo View by S. Ross Taylor, 1975, Pergamon Press.
Reluctantly, we must take leave of our local satellite to begin an impressive journey through the Solar System. We start with the two innermost planets–Mercury and Venus.