Sea Ice Monitoring
Contents
Sea ice is both an oceanographic and a meteorological feature. Satellites are almost the only convenient way to monitor ice accumulations in the polar regions. Satellites with high resolution sensors can also detect icebergs. Generally, any spectral band in the visible is suited to spotting ice but thermal imagery and radar (especially at night) also will find it. Some examples of what can be seen from space substantiate the utility of satellites for picking out ice distribution - of vital concern to those who must travel in shipping lanes where passage may be impossible or where dangers lurk. (The big “what might have been” question: could satellite observations have saved the Titanic?)
Sea Ice Monitoring
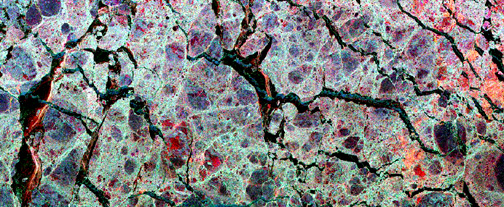
` <>`__14-36: Why does this ice show a blocky or patchwork pattern? **ANSWER**
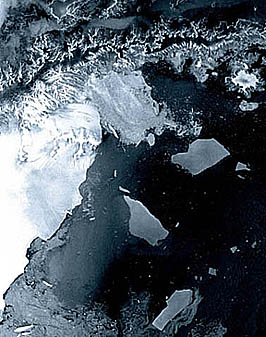
Sea ice may retreat during the summer but reform in new patterns as winter ensues, as shown in this Landsat image off the Greenland coast:
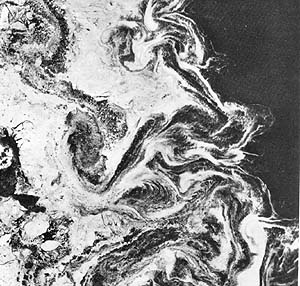

` <>`__14-37: Which way are the ice eddies swirling? **ANSWER**

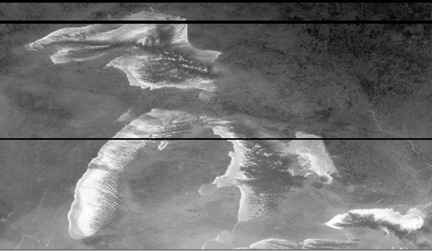
Sea ice distribution over a large region is effectively being monitored now by the MODIS sensor on Terra (see Section 16). Here is a view of ice passing through, and blocking, the Bering Strait between Siberia and western Alaska.
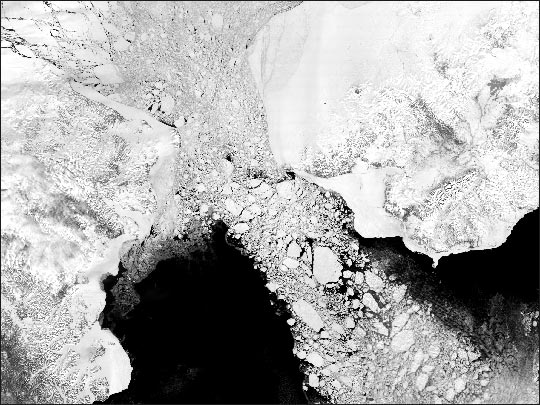
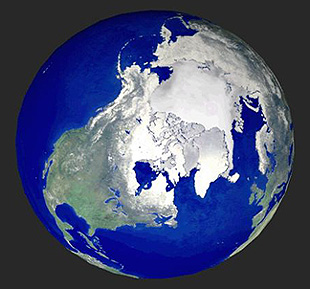
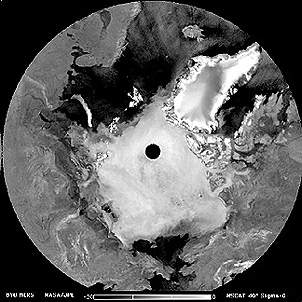
The polar regions of the Northern Hemisphere are covered by sea ice, ice caps or sheets (e.g., Greenland) and snow, as depicted by this composite image constructed from Radarsat SAR images:
Next, we show the growth and shrinkage of the ice fields surrounding Antarctica as sensed by ESMR that appeared earlier in this section. Below these images are SMRR images that show changes in the ice cover for four years, during the 1978-86 period, in the top diagram.
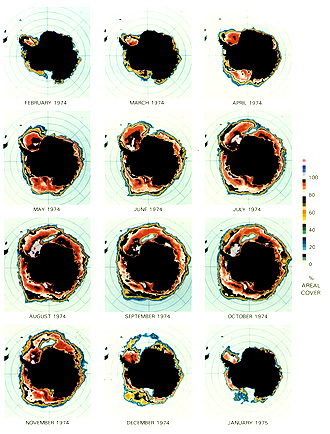
` <>`__14-38: In the lower of these two diagrams above, why is ice minimal in December? In the upper diagram, what is ice-covered besides the Arctic Ocean? **ANSWER**
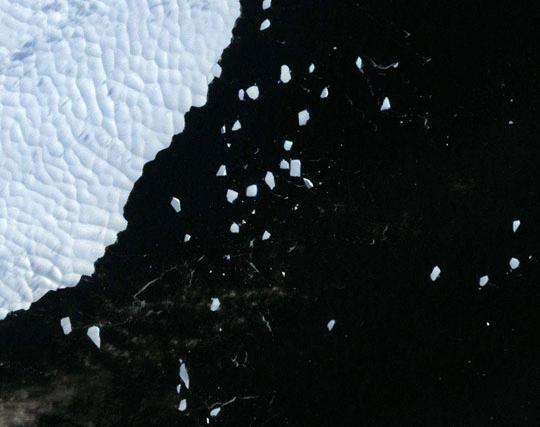
The ice shelf surrounding the Antarctic continent extends sometimes 100s of kilometers from shore. Periodically parts of its edge will break loose and float free in the southern ocean. In 1995 a large (greater than Rhode Island in size) raft of ice, assigned the identifier B10, separated and starting moving north. It later broke again into two sections. Small pieces continue to break off (calve) as icebergs. Here is a Landsat image of B10A showing the sheet and its offspring ‘bergs:
In early 2002, another great slab of ice from the Larsen ice shelf, between the Bellingshausen and Wendell seas, broke off and is now cruising the sea off Antarctica. Here is a scene during this rupture stage, imaged by the ASAR radar on the Envisat (see Overview) launched in February 2002.
While some changes in sea ice (and ice cap) cover, both in area and thickness, may be progressing towards lower overall areal extent because of natural/man-induced global warming, there are as well normal seasonal fluctuations. Here are two sets of images made by the AMSR-E sensor on Aqua (page 16-11) of Arctic sea ice and Antarctic shelf ice during two periods in 2002 between June and July:
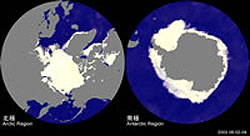
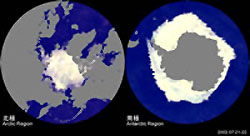
In the northern hemisphere, the ice shrinks in extent as the summer progresses. But in the southern hemisphere, where it is winter at this time of the year, the ice shelf around the Antarctic increases.