Hurricane Andrew; 1993 Storm of the Century; Hurricanes & Tornadoes
Contents
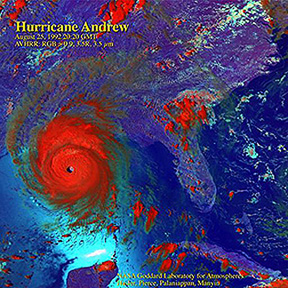
This part of Section 14, which deals with meteorological satellites and the value of observing the Earth�s weather system from space, closes with two major episodes in the 1990s that made weather history. The first was Hurricane Andrew in 1992 which struck land below Miami; before it dissipated to the north, it caused $30 billion dollars in damages - the costliest natural disaster in American history. The second was the infamous “Storm of the Century” in March 1993 which buried the northeast U.S. under a massive snowfall. Satellite images give some idea of the intensity of both these events. Hurricanes are by faar the most costly (in terms of scope of damage) of storms. Tornadoes, also very destructive, can sometimes be captured (actually, the unstable air mass that spawns them) in satellite imagery and damage assessment made through space imagery after the storm has passed. Lightning strikes, another storm hazard, happen with high daily occurrences and are most frequent in central Africa and South America, as determined from data obtained by sensors dedicated to their detection.
Hurricane Andrew; 1993 Storm of the Century; Hurricanes & Tornadoes
We close this part of Section 14 with several special-interest stories.
` <>`__14-25: What do you think happened to Andrew after it made its second landfall around the Mississippi Delta? **ANSWER**
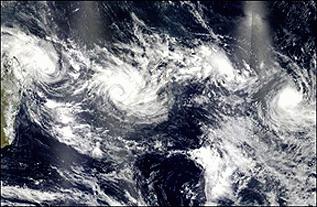
The Terra and Aqua programs are the subject of Section 16. These two satellites are not designed specifically as metsats but they do gather considerable data pertinent to weather and climate. Here is a Terra MODIS image of 4 hurricanes (typhoons in the eastern hemisphere) crossing the western Indian Ocean on February 12, 2003:
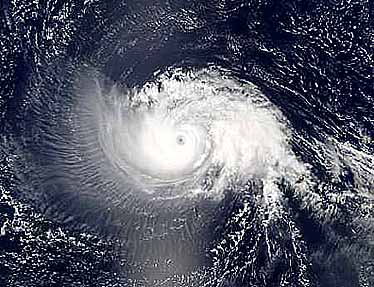
MODIS has proved a valuable adjunct to hurricane monitoring since its field of view can encompass an entire storm. In September of 2003, Hurricane Isabel reached a category 5 status (winds in excess of 146 mph) as it approached the U.S. Here’s how it looked on September 9.\:
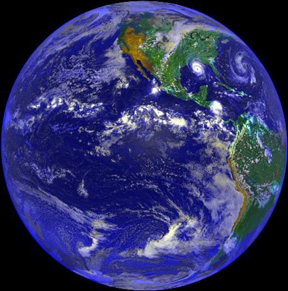
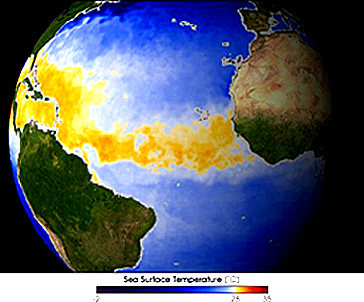
Satellites that measure ocean water temperatures give forewarnings of thermal conditions in tropical waters that control and breed hurricanes and tropical storms. This image, made by the AMSR instrument on Aqua, shows the heating of Atlantic equatorial waters in the early summer of 2003:

The writer (NMS) at the time was in Bloomsburg, Pennsylvania, preparing to leave the next day to give a paper on the Manson Impact Structure (see page 18-2) at the Lunar and Planetary Science Conference in Houston, TX, the first he was to attend since the original Conference on Apollo 11 moon rocks 23 years earlier. It was not to be. Snow locally exceeded 60 cm (24 in), driven into deep banks by winds. All Interstate highways within Pennsylvania closed for two days.
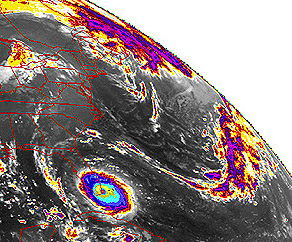
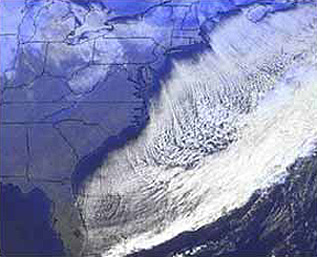
Metsats are excellent monitors of less violent, more conventional, but still interesting weather data. We are all familiar with the passage of cold fronts, followed by clear weather as a pressure high moves in. Commonly, moist, warm air is encountered by the front and develops into a broad area of clouds and often stormy weather. This next image shows the sharp leading edge of a front now off the Atlantic coast of the U.S. and out to sea. At its back edge is another sharp boundary beyond which cold, dry air is moving in.
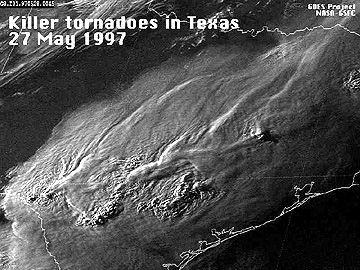
Lastly, tornadoes, while much more localized than hurricanes or subcontinental storms, can do incredible damage to the areas on which they touch down. Low pressures, and wind velocities that can exceed 200 mph, will flatten buildings (tornadoes have a special fondness for trailer parks), uproot trees, and carry objects for hundreds of feet to even miles from their spot of origin. The storms that brew them are effectively tracked by ground radar and by satellites (usually geostationary). On May 27, 1997 several lines of storm clouds bearing multiple funnel clouds crossed central Texas with deadly results. Here is a GOES-8 image of these advancing fronts.
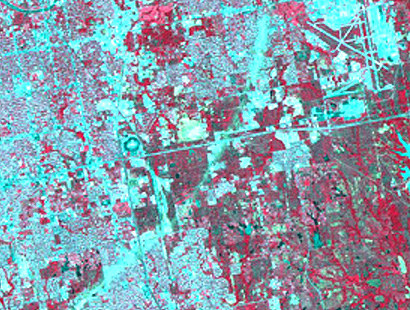
When a storm has passed and the sky clears, a passing satellite can often see the actual damage if conditions are right. This was the case three days after a killer tornado touched down on May 5, 1999 within Oklahoma City, OK., cutting a path through city and suburbs and just missing the airport. Look for the diagonal blue strip in this IRS-C LISS false color composite - this marks the zone of heavy destruction.
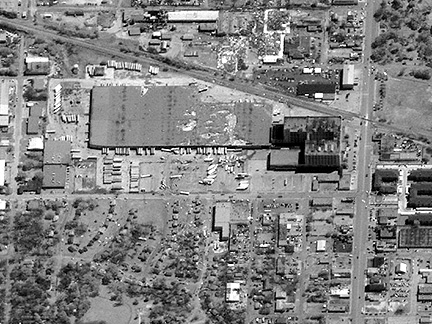
Now that IKONOS and other high resolution sensors are operational, it is feasible to inspect damage from tornadoes in considerable detail - equivalent to flying an aerial photo mission. A tornado touched down in Fort Worth, TX, ripping off roofs from warehouses and other buildings, as evident in this 1 m resolution IKONOS image.
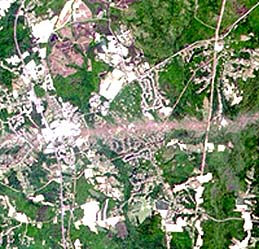
The first tornadic storm of 2002 to produce multiple deaths (4) occurred on April 28 around La Plata, Maryland, about 40 miles southeast of Washington. This may have been an F-4 tornado (the second highest wind category) and as such was the most powerful ever to hit Maryland (and one of the strongest ever to hit the East Coast region). Within just two days, the narrow path of destruction (that was, however, 6 miles long) in which several hundred buildings were damaged was imaged by EO-1, as seen here (the pink color was caused by destruction of vegetation [reducing the natural green input]):
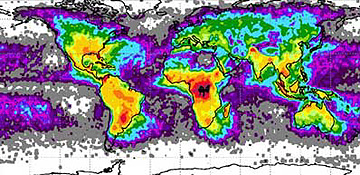
Still another hazard, and sometimes a killer, associated with usually severe storms are lightning strikes. Worldwide thousands of individual lightning discharges, including dramatic bolts, occur each day.This next map shows the geographic distribution of the frequency of strikes averaged over 5 years (1995-2000) of data collecting by NASA’s Optical Transient Detector and by the Lightning Imaging Sensor on TRMM. Note that the central part of Africa has the most lightning strikes; almost all of South America is prone to frequent electrical storm activity.
A different perspective occurs when one looks at the distribution of lightning strikes on a monthly basis, as plotted in this global map.

Still, when compared with the previous global map, similarities are evident.
Primary Author: Nicholas M. Short, Sr. email: nmshort@nationi.net