Geostationary Satellites


The various geostationary satellites from several countries, either now functioning or having become non-operating, provide synoptic views of about one-fourth of the Earth�s surface. The part (it remains the same) they cover depends on where they are located relative to a point along (close to) the equator. By completing their orbit once every 24 hrs, they stay fixed relative to Earth�s equatorial rotation and thus are “stationary” in space. This page concentrates on the U.S.�s GOES series but similar satellites from other nations� space programs are discussed. Thus, in today�s world, mankind has an excellent network of satellites monitoring the Earth�s weather systems.


Geostationary Satellites


We switch now to consider the second general class of metsats: those in geosynchronous orbit. That orbit is achieved when the spacecraft is “parked” above the Earth at 35,800 km (22,300 miles) and is moving along a circular path around the planet at approximately 11052 km/hr (6802 mph). A point on the Equator that remains directly underneath is traveling at ~1667 km/hr or 1042 mph. At these speeds there is no relative motion differences, so that the observing satellite is synchronously locked into a geostationary position above the hemisphere it is intended to view and (unless it drifts) will always view the same scene. (See also page 19-2.)
Most imagery shown on TV News Weather segments comes from these satellites. Launched on December 7, 1966, the first such satellite was the Applications Technology Satellite-1 (ATS-1), which employed the Spin Scan Cloud Camera (SSCC) to obtain visible images of the western hemisphere. The value of synoptic coverage over short time spans was quickly proven by images such as these:

Series of ATS-1 SSCC images of the western hemisphere of the Earth.

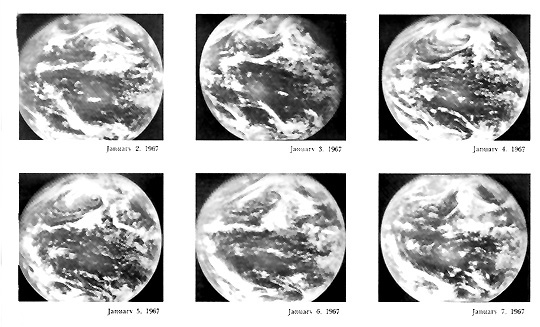
` <>`__14-16: Comment on at least one mega-weather pattern in the northern and in the southern hemispheres as time progresses from January 2 through the 7th. **ANSWER**

Rapid improvement in vidicon technology led to the first color system, the Multicolor Spin Scan Cloud Camera (MSSCC), on ATS-3 (launched November 5, 1967), producing striking portraits of entire continents such as this view of South America:

Color ATS-3 MSSCC image of South America.

` <>`__14-17: Is that a hurricane at about 1:00 o’clock in the hemisphere, off the Spanish coast? **ANSWER** ****

The beginning of an operational system dates to May 17, 1974, with the launch of the first of two Synchronous Meteorological Satellites (SMS). Each SMS carried, as its principal sensor, the Visible Infrared Spin Scan Radiometer (VISSR). These were predecessors to NOAA’s Geostationary Operational Environomental Satellite (GOES) series-the kingpin of present day geosynchronous systems, covering the western hemisphere. Here is an artist’s drawing of the GOES-8 spacecraft:

Artist's drawing of the GOES-8 satellite.

GOES-1 arrived in a geostationary orbit at 135° W, soon after its launch on October 16, 1975. Others launched at two to three year intervals (coincidentally, GOES-10 entered its orbit on April 25, 1997, the same day the author wrote this paragraph). We refer to the satellites covering the Atlantic Ocean and the eastern U.S. as GOES-East (located above the equator at 75°W longitude), and those over the Pacific as GOES-West (at 135°W longitude). Together, they provide coverage of both the Atlantic and Pacific, as shown in this drawing which also illustrates the full disk nature of the view:

Artist's drawing of the hemisphere views from the two GOES normally working together if both are working.

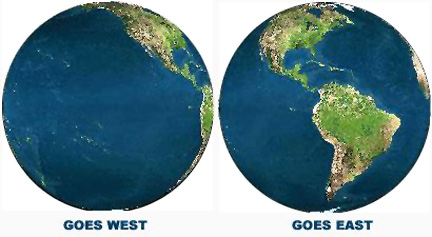
To cover the entire Earth, four GOES would be needed. However, other parts of the world are monitored by other systems (see next page). As of mid-2000, GOES-8 and GOES-10 are operating, with GOES-9 and GOES-11 also in orbit but in storage until one or both of the first two fails.

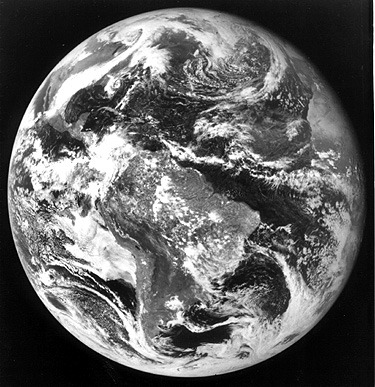
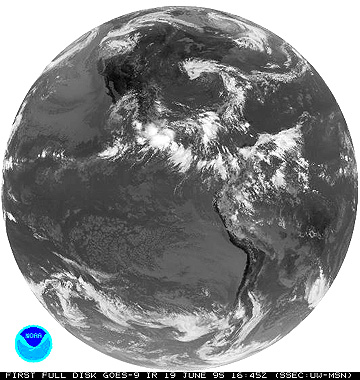
Again, VISSR is the chief sensor, but sounding (VAS is the VISSR Atmospheric Sounder) capabilities are also onboard. Starting with GOES-8 (April 13, 1994), the VISSR operates all of the time, rather than providing periodic views. To exemplify GOES imagery, we now show the first visible image (top) from GOES-1 on October 26, 1975 and the first test IR image (bottom) from GOES-9 on June 19, 1995:

GOES-1 visible image of South America; October 26, 1975.

GOES 9 thermal IR image of South America; June 19, 1995

We can subdivide these hemispherical images to concentrate on specific areas. Here are two GOES-8 (East) images: the top one focuses on a large continental storm on March 20, 1994, whereas the bottom one shows a front passing off the Atlantic coast on November 27, 1996:

GOES-8 (East) visible image of a large low over the East Coast of the United States, creating storming conditions on March 20, 1994.

GOES-8 (East) visible image showing the passage of a front (with clouds preceding colder, drier air to the west, off the U.S. East coast, November 27, 1996.

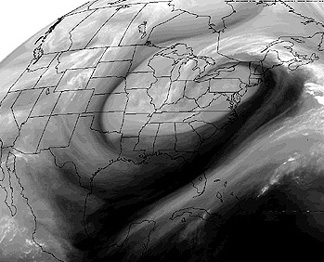
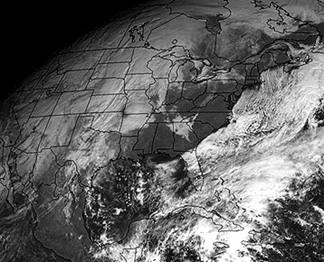
` <>`__14-18: The March 20th storm shown in the upper of the two images just above resulted in a huge snowfall over its northern segment. The cloud pattern resembles a hurricane but there are differences. Mention several of these.` <Sect14_answers.html#14-18>`__**ANSWER**

The GOES-8 sounder has a visible band and 18 thermal bands, which are sensitive to temperature variations related to CO2, ozone, and water vapor at different atmospheric levels. We can convert each band into an image, to which we assign colors, to identify thermal differences, as demonstrated in this panel of images taken on May 5, 1997.

Series of colorized GOES-8 sounder and thermal band images, May 5 1997.

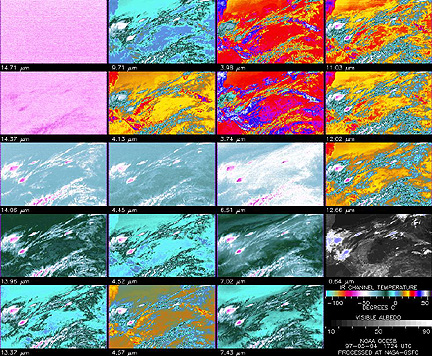
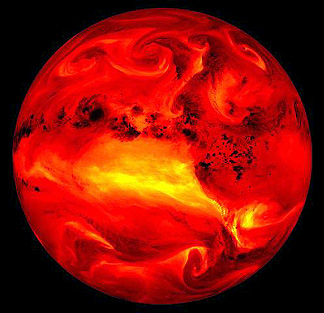
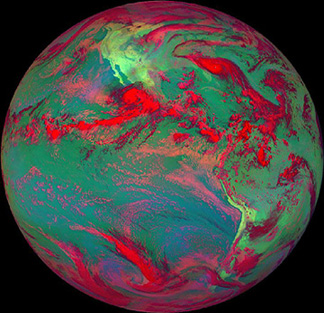
Unusual color composites can be made from different channel images. On the top (or left) is a colorized rendition of the 6.7 µm channel image from GOES-8, which is sensitive to water vapor distribution, highlighting a big U.S. storm on March 20, 1994. On the bottom (or right) is a false color image made from Channel 6.7 µm = blue; 11 µm = green; Visible = red. This GOES image displays Hurricane Hugo, as seen on September 21, 1989.

Colorized GOES-8 image sensitive to water vapor distribution, March 20 1994.

False color GOES-8 image showing Hurricane Hugo, September 21 1989.


Primary Author: Nicholas M. Short, Sr. email: nmshort@nationi.net