The NOAA Series
Contents
The TIROS and Nimbus series of metsats were initiated by NASA (mainly at the Goddard Space Flight Center). The National Oceanographic and Atmospheric Administration began developing and flying its own series, NOAA-6 through NOAA-15, as its mission made it the responsible agency for operational civilian meteorological satellites. Several TIROS satellites were dove-tailed with the NOAA program. Most of the NOAA series carry a version of the AVHRR sensor, usually with three bands in the Vis-NIR and two in the thermal region. Several hurricane images typify these NOAA products.
The NOAA Series
A new series in this generation began with the launch of TIROS-N on October 13, 1978. This satellite was the first in that series to carry the AVHRR (described on page 14-2), along with the first sounder, TIROS Operational Vertical Sounder (TOVS), designed to profile temperature and water vapor. The TOVS is actually a three instrument complex: the High Resolution IR Sounder (HIRS-2), with 20 channels; the Stratospheric Sounding Unit (SSU), with three channels near 15 µm, and the Microwave Sounding Unit (MSU), a passive scanning microwave spectrometer with four channels in the 5.5 µm interval.
These instruments are the mainstays of the subsequent NOAA-6 (launched on June 27, 1979) through NOAA-15 (May 1998) metsats. The SBUV is also part of NOAA-9 and NOAA-11. Even-numbered NOAA metsats have North to South equatorial crossing times near 7:30 A.M. and have orbital repeat periods (re-occupy approximately the same paths) of four to five days. The odd-numbered ones cross the equator from North to South at night (2:30 A.M.) and have eight-nine day repeat periods. NOAA strives to keep as many as four satellites in this series operational at any one time.
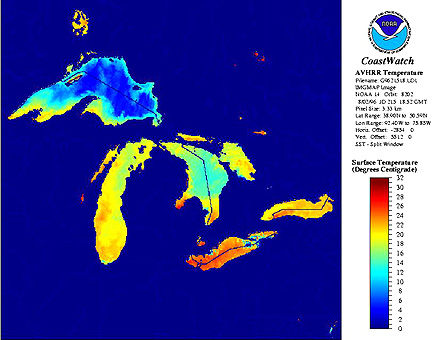
The thermal bands on AVHRR can generate temperature “maps” of water bodies, both oceans and lakes. Here is a thermal image of the temperature in early Fall in the five U.S. Great Lakes:
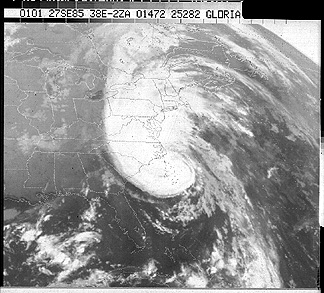


` <>`__14-15: This is a classic portrayal of a hurricane’s appearance. Deduce from the directions of motion implied by the swirls in the hurricane’s spiral pattern which way the circulation (clockwise or counterclockwise) of the winds is taking place. **ANSWER**
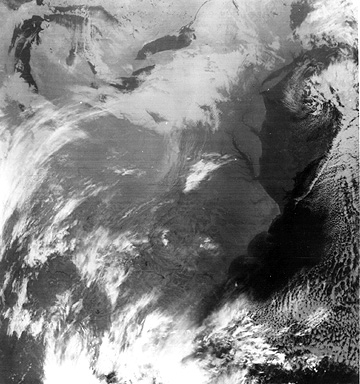
The NOAA daily images are compiled and displayed in different formats. Here is a NOAA-14 image taken on June 26, 2000 that covers European Russian eastward into Siberia.
The latest in the NOAA group, NOAA-15, has these instruments: AVHRR/3; AMSU A & B (sounders); HIRS (an infrared sounder); SEN (Space Environmental Monitor); SAR (Search and Rescue); and DCS (Data Collection System. Its AVHRR now has a sixth band, at 1.6 µm. The AMSU-A is capable of producing temperature profiles, as exemplified by this cross-section through Hurricane Bonnie.
The former Soviet Union/CIS has launched more than 25 polar-orbiting metsats in its three Meteor Series, starting in March of 1969, and continuing through 1994. Other metsats were part of their Kosmos series
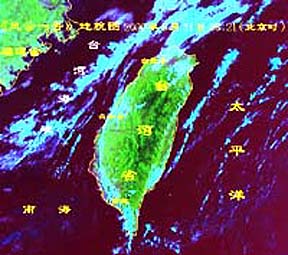
China, too, is now in the metsat field. Here is an image of the “wayward province”, Taiwan, imaged by its polar-orbiting Fengyun (FY-1C) satellite on May 10, 1999.