ESSA, DMSP, SSM/I; TRMM
Both military and civilian meteorological satellites have been operating in space for almost four decades. Some are specialized, with particular mission goals or objectives to measure parameters not routinely determined by the main stable of metsats. ESSA is a series of 9 satellites making environmental observations, including weather phenomena. The military DMSP series looks at Earth both in the Vis-NIR and the thermal regions. It is tailored to provide data that support military operations, with direct data readout available to personnel worldwide. One of its sensors, the SSM/I senses microwave radiation relevant to both cloud and rainfall conditions. TRMM is a joint U.S./Japan satellite capable of global coverage of rainfall, particularly in the Tropics.
ESSA, DMSP, SSM/I; TRMM

` <>`__14-12: What’s missing in this image? **ANSWER**

` <>`__14-13: Why is the green in the above map where it is? **ANSWER**

The first satellite whose primary mission is to measure precipitation is the Tropical Rainfall Mapping Mission (TRMM), a joint research project between the U.S. (NASA) and Japan (National Space Development Agency: NASDA). A basic objective of TRMM is to obtain estimates of the vertical profile of the latent heat (heat resulting from a change of state), released through condensation of water vapor in the atmosphere, especially in the Equatorial Intertropical Convergence Zone (ITCZ). The TRMM is a large spacecraft that a joint engineering team built at NASA’s Goddard Space Flight Center and successfully launched in Japan on November 27, 1997. The TRMM Observatory has three primary instruments:
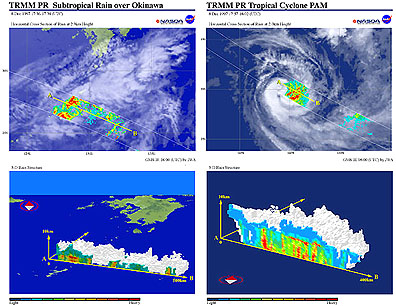
I. The Precipitation Radar (PR), built in Japan, measures 3-D rainfall distribution. The PR is an electronically scanning radar that operates at 13.8 GHz using horizontal polarization with a 129-slotted waveguide antenna. It has a horizontal resolution of 4.3 km (2.7 mi) at nadir and a scanning swath width of 220 km (137 mi).
II. The Multi-Channel Microwave Radiometer (TMI), collects data on the integrated-column, precipitation content, its areal distribution, and its intensity. The TMI operates at five frequencies, ranging from 10.65 GHz (45 km [28 mi] spatial resolution) to 85.5 GHz (5 km [3.1 mi] resolution). Dual polarization at four of the frequencies provides nine channels. At a 65¡ scan angle, the swath width is 760 km (472mi).
III. The Visible Infrared Scanner (VIRS) provides high resolution (2.1 km [1.3 mi] at nadir) information on cloud cover, cloud type, and cloud top temperatures, being a radiometer, operating at 0.63, 1.6, 3.75, 10.8, and 12.0 mm wavelengths.
In addition, the spacecraft’s load includes the Lightning Imaging Sensor (LIS) (at 0.777 mm wavelength) capable of picking out lightning flashes associated with active rainfall and the Clouds and Earth’s Radiant Energy System (CERES), a broad-band, scanning radiometer, designed to measure reflected and emitted radiative energy at the surface and for the atmosphere and its constituents.
A goal of this low-altitude (350 km [217 mi]), non-sun-synchronous (precessing) satellite is to provide monthly precipitation data over 500 x 500 km grids, especially for the tropical-ocean regions. A network of ground stations to produce corroborating ground truth is under development. You can find more information and updates on this spacecraft and its products at this NASA Goddard TRMM Home Page.
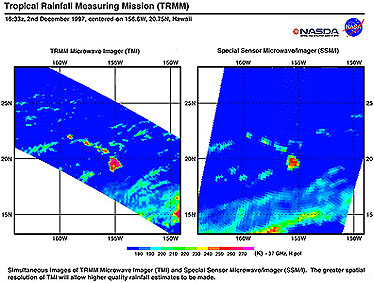
By December, 1997, the TRMM investigators released the first images to the Net. We reproduce three representative ones here, and you can access others via the above URL. The first compares images over the Hawaiian Islands, obtained simultaneously by TRMM’s TMI sensor (left) and the SSM/I on the current DMSP satellite. The improved resolution of the TMI is evident. The islands were largely cloud-covered with localized rainfall (reds).
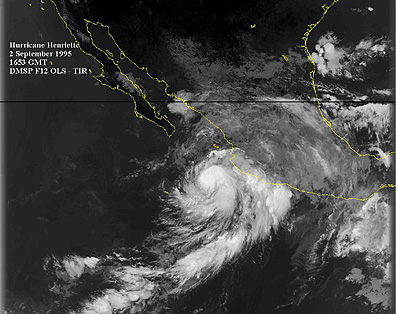
The second images show Typhoon Pam in the western Pacific, south of Okinawa in early December. The imaged cloud tops appear gray, and the colors in the flat projection represent relative rainfall intensities. The side view (cross-section) is an extrapolation of data to indicate rain distribution within the cloud mass.
The next image is a composite from several-days coverage showing worldwide rainfall during part of December. Major cloud masses are in white, areas of moderate or intermittent rainfall in purple, and heavier rains in reds, yellows, and greens. Can you locate a small hurricane in this image?
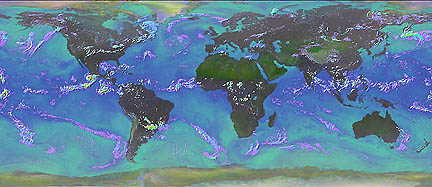
` <>`__14-14: In several parts of the world, there are long, linear patterns of purple rainfall. Suggest a possible explanation. Can you locate a small hurricane in this image? **ANSWER** ****
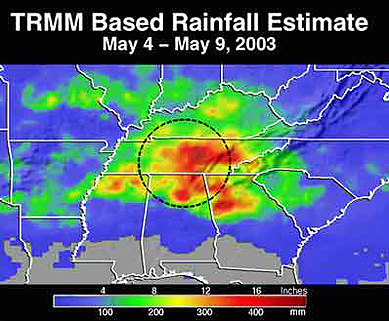
One of TRMM’s prime accomplishments is its ability to measure cumulative rainfall in selected areas over short time spans. The Spring of 2003 was very wet in the southeast, with a higher than normal number of tornadoes. In this map of rainfall, TRMM determined that up to 16 inches of rain fell in Tennessee and parts of adjacent Alabama and Georgia over a 6 day stretch in early May.
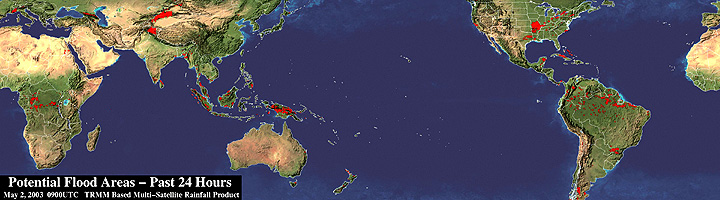
TRMM now has the capability of producing maps that are effective in making flood forecasts. These maps single out (in red below) areas of land that receive 1.5 inches or more in a 24 hour period. They in turn can be used to predict possible flooding conditions at 3 and 7 days after the heavy rainfall. Here is a worldwide rainfall map (>1.5 inches in red) for May 2, 2003: