THE WATER PLANET: METEOROLOGY, OCEANOGRAPHY AND HYDROLOGY FROM SPACE
Contents
The earliest applied uses of space satellites were in communications and meteorology. The first U.S. meteorological satellite was TIROS-1 launched in April of 1960. Since then NASA, NOAA and other agencies (e.g., DOD) have sent scores of satellites in Earth orbit or into geostationary positions, using increasingly sophisticated sensors to observe various properties of the terrestrial atmosphere, and its climate changes. Other nations have followed suit, so that today TV Weather reports always contain supporting imagery showing regional meteorology ranging from local areas to entire continents. Meteorology itself is a major component of the Hydrologic Cycle which also embraces Oceanography and land Hydrology. This first page considers the general background to “metsat” observations and cites references on the Net and in books that provide the interested user of this Tutorial with sources that expand knowledge of the principles of Meteorology/Oceanography and other aspects of the “water world”. Some quality links to other weather-oriented sites are given.
THE WATER PLANET: METEOROLOGY, OCEANOGRAPHY AND HYDROLOGY FROM SPACE
The Hydrologic Cycle; Meteorological Satellites (General)

(Christopherson, R.W., GEOSYSTEMS: An Introduction to Physical Geography, 2nd Ed. © 1994. Reproduced by permission of Prentice Hall, Upper Saddle River, New Jersey)
` <>`__14-1: What in the diagram accounts for the least amount of water relocation? What category of temporary water storage is not cited in the diagram? **ANSWER**
The numbers associated with this chart clearly demonstrate that the oceans not only hold the bulk of the planet’s water but are the source of most of the precipitation that constantly recycles water. Water in transit appears as circulating (wind-driven) visible clouds and invisible water vapor or as water mobilized in fluvial systems. In addition to the ocean bulk, which accounts for nearly 98% of the volume of water at or near the Earth’s surface, most of the remaining fraction is ice, mostly in the Antarctic and Greenland, snow (much being seasonally ephemeral), and freshwater lakes.
Most remote sensing observations tend to be two-dimensional, that is, the sensors look at the surface or very near surface. Geophysical remote sensing is, in part, 3-dimensional as the instruments used can provide information about the supracrustal rocks (e.g., sedimentary sections) and the crystalline basement crust and some techniques provide information about the mantle and even the Earth’s core. Meteorological remote sensing is primarily directed towards making observations of the atomspheric profile - the column of air above the ground which varies in temperature, pressure, and composition. This atmospheric mantle has been divided as shown in this figure, which also show the general variations of temperature with altitude (height above the surface):

From Lutgens and Tarbuck, “The Atmosphere”
The advent of satellites after Sputnik (in 1957) opened large regions in sweeping vistas for directly observing atmospheric properties, weather systems, oceanographic conditions, and water runoff on continents and islands. We could easily combine a series of adjacent scenes, acquired during short time periods, in mosaics to give global coverage on a daily basis. In time, satellites placed in geosynchronous orbit afforded nearly instantaneous coverage of hemispheres of the Earth that could rapidly update views of cloud decks and circulation patterns over almost any part of the world. Ironically, the very thing that compromises observations of the land and open ocean, namely clouds, is the prime target of meteorological satellites (metsats). As more versatile sensors evolved, they quantitatively monitored various other atmospheric or oceanographic properties, such as the stratosphere, tropospheric temperatures, Earth radiation budget, air chemistry (e.g., ozone, CO2, sulphur compounds, and aerosols), wind and sea current movements, sea-ice, and marine biotic nutrients.
` <>`__14-2: What spatial attribute of a sensor system is highly desirable in a meteorological satellite? **ANSWER**
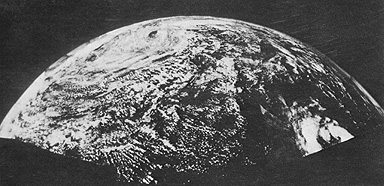
Common sense tells one that satellites or spacecraft hundreds to thousands of kilometers above the Earth looking down towards its surface will see large areas at a time. Clouds and other weather phenomena scanned over wide vistas would give meteorologists a much better handle on moving weather systems. This became possible after Sputnik; some of the early efforts to utilize space for meteorological studies are briefly described on page 14-4. We show an image that surely kindled excitement among the weather people - indicating the value of the panorama approach - even before orbiting satellites went on line. It is a mosaic of photos taken from an Aerobee rocket that reached great heights during a 1974 mission from its launch site at White Sands Proving Grounds, New Mexico (the writer [NMS] saw his first launch of a V-2 rocket there in 1947 when, as a reporter for the Fort Bliss, TX newspaper, he was assigned to interview the famed Wernher von Braun). A significant part of the northern hemisphere, with its various cloud systems, was viewed in this composite.
The first ever United States satellite in Earth orbit designed specifically to image and monitor conditions on and above the surface was the meteorological satellite called TIROS-1, launched on April 1, 1960 soon after NASA came into existence. It looked like this.

It was powered by solar energy collected from the 9260 solar cell plates on its exterior. Being small (42 inches or 106 cm) in diameter, it carried two TV cameras, one with low the other with high resolution. Here is the first image taken by the “Adam” of meteorological satellites.

From 1959 through 1994, many countries launched satellites (approximately 270–a few failed), such as the United States, the former Soviet Union/Russia, Japan, China, India, Italy, France, and the European Space Agency, primarily to provide current timely data for weather system monitoring and forecasting but also to conduct scientific studies to better understand the atmosphere, the oceans, the Earth’s force fields (ionosphere and magnetosphere), solar radiation, and related aspects of the environment. In contrast, so far, they dedicated fewer satellites to land observations. Astronauts conducted meteorological experiments during Mercury, Gemini, Apollo, Shuttle, and Mir flights.
Clearly, the most widespread applications to date of remote sensors operating from space platforms have been to image water - either in oceans, lakes, and streams or in the air as water vapor - in its main functions in the Earth System. But, as the sensors improved, the ability to measure temperatures, and indirectly pressures (highs and lows), in the atmosphere as well as wind speeds and the rates of movements of air masses became possible in a quantitative way. But, the single most obvious thing that meteorological satellites (also referred to as metsats) could observe from the beginning are clouds. Most cloud formations (cumulus, stratus, nimbus, and combinations thereof) are straightforward and obvious as to types, but some unusual atmospheric effects expressed by clouds warrant special attention.
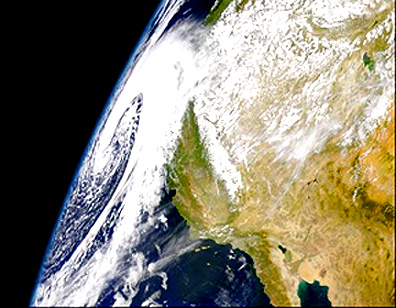
One of the most striking, and common, cloud patterns is the spiral swirl associated with a major low that delivers rain and even stronger storms, such as hurricanes. Wide field views can encompass the full systems of clouds comprising such lows. This view of an incoming storm low (swirls move counterclockwise) approaching the coast of California was made by the SeaWIFS instrument on the OrbView-2 satellite. The low has been compressed into an ellipse because this view actually looks to the horizon, causing the storm clouds to appear distorted owing to the curvature of the Earth.
The scale of Landsat images, covering 180 km on a side, is especially suited to showing clouds in some detail but over an area in which their context is well displayed.
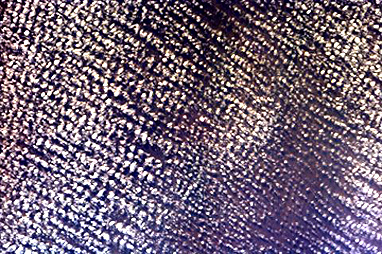
This Landsat image shows a pattern of stratocumulus cloud cells, each about 7-10 miles (10-15 km) over the Pacific Ocean. As warmer air rises in convection cells over the ocean and cools, condensing the clouds, cold air then sinks around the sides of the cells. The dark space between cloud cells is not the ocean itself but a thin mass of water vapor, with low reflectance, associated with the sinking air.

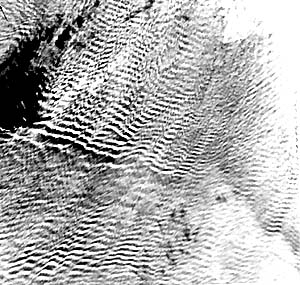
Stratocumulus clouds can often arrange themselves in waves, much like ripple marks on sand dunes, as evidenced in this Landsat image taken over the Barents Sea, near the Kola Peninsula:
Linear cumulus clouds, now broken up but still aligned, appear over Kenya in this image:
This next image, taken by the MISR sensor on Terra, is known as a “cloud street”. A chain of swirls, known as von Karman vortices, has formed from stratocumulus clouds on the leeward side of the Beersburg volcano (about 2.2 km high) rising on the Jan Mayen island (Norwegian) 600 km east of Iceland. Winds streaming past this local obstruction induce the rotational perturbations that are expressed downwind as the vortices.
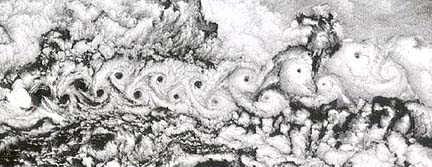
As you will see on subsequent pages, most satellites whose prime purpose is to gather meteorological observations and atmospheric properties data produce images covering a wider area of view than the above examples. One non-metsat satellite, HCMM (the Heat Capacity Mapping Mission), has an FOV yielding a swath width of 716 km (447 miles). It has yielded a number of cloud-rich images in which the details of individual cloud groups are evident. Consider this view which shows von Karman cloud vortices in the Pacific Ocean west of Baja California. They begin to form near the coast as subsiding air caused by local coastal convection sets up the eddying motion that generates these clouds whose bases are perhaps about 300 m (1000 ft) above the sea surface.
|HCMM Day-VIS image of stratocumulus clouds off the Baja California coast. |
Now consider this next pair of HCMM images taken during the day on December 5, 1978, which reveal some characteristics of air masses. The top image is in the Visible-Near IR (0.5-1.1µm); bottom is a Thermal IR (10.5-12.5 µm) image.
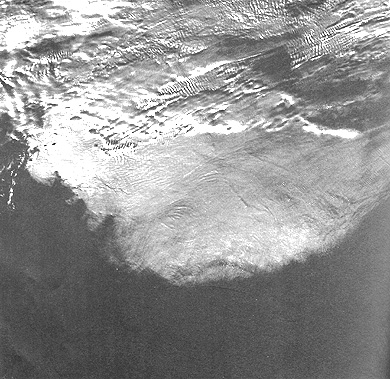
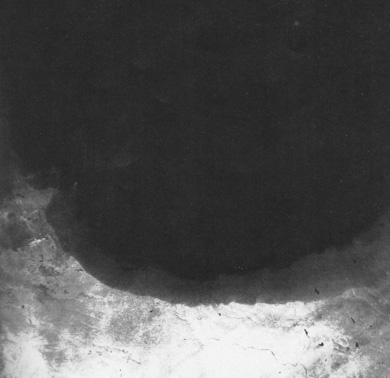
At first glance, the top image looks like a bank of clouds extending over a featureless cold body which could be the ocean somewhere. But the bottom image shows that dark area to be land and the cloud cover to be uniformly cold. The area of clouds is now uniformly dark - hence very cold - compared with the somewhat warmer land mass that lies around the border between north Texas and south Oklahoma. In the top image, the land surface was uniformly cold and hence featureless. In the bottom image, the boundary between visible land and cold clouds indicates the sharp front between the advancing colder air mass on the north and warmer air to the south.
As their ultimate achievement, meteorological satellites can give near real time global coverage of the active but transient weather systems of our planet. As we shall see shortly, both polar and geostationary orbiting satellites provide observations that facilitate this. That worldview is well illustrated by this 1983 map of cloud patterns and sea ice:
To most of the general public, including many in the technical fields, the one incursion of Earth-observing satellites into everyday life comes during the Weather segment of the TV news. We are familiar with synoptic views of clouds over our home region, as well as panoramas across the continent in which we live. These weather maps usually come from visible and thermal IR bands on sensors mounted in geostationary satellites. Even more common are images made by ground-based Doppler radar systems that sweep circular pattern. Radio signals bounce off (are scattered by) particulates, such as raindrops or ice, and return to the antenna, yielding estimates of precipitation amounts and wind speeds (using the Doppler principle [see page 8-2], in which frequencies increase [decrease] as the reflecting particles move towards [away from] the radar site).
Currently, in the U.S., the National Oceanographic and Atmospheric Administration’s (NOAA) National Weather Service operates most weather radars. Their Next Generation Radar (NEXRAD) network consists of S-band radars at 164 stations across the country. This system especially detects and warns of severe storms, tornadoes, and flood-generating heavy rains. Here are two examples: cloud patterns on the top and precipitation on the bottom, for the 48 states, downloaded from the Accuweather site (http://www.accuweather.com). on the day this paragraph was written.
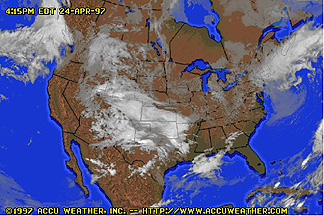
By arranging frequent observations into a time-lapse sequence (usually over an interval of the last 6 to 24 hours), the system creates and displays a ” movie” of advancing weather systems from local to continental scales. .
` <>`__14-3: What particular types of weather maps or images do you remember seeing on the Weather segments of the local news shows you watch on TV?` <Sect14_answers.html#14-3>`__**ANSWER**
(As a parenthetical input, since nowhere else in the Section does the folowing information seem relevant: 1) the hottest temperature ever recorded on Earth was at Azizia, Libya - 57.8° C or 136° F [Death Valley, California once reached 134° F]; 2) the coldest spot was - 89° or -121° F; 3) the wettest area was around Llaro, Columbia which received 323.6 inches of rain in one year.)
Section 14 reviews the history and accomplishments of this use of satellites to monitor the daily changes of the Earth’s weather systems, oceans, rivers, and snow/ice and to conduct long-term research into the interactions of the atmosphere and hydrosphere that control the meteorological state of the planet. This subject is vast-worthy of its own web site-and many web sites now exist, as you can ascertain by doing a internet search. We introduce only a digest of the types of observations-mainly by presenting images and a few graphs-in this brief, simplistic, and generalized treatment. We emphasize meteorological applications, with an abbreviated summary of selected oceanographic (surface temperatures, seastate, currents, and phytoplankton distribution) and hydrologic (flooding, water storage, and drainage regime) uses. Many people working through this tutorial may lack knowledge in meteorology, and even more so, in oceanography and hydrology. For those who seek a broad overview, or wish to delve into greater technical and scientific details, we suggest perusal of a good introductory Meteorology or Oceanography text or, better yet, the relevant chapters in a Physical Geography text, such as:
Satellite Meteorology: An Introduction, S.Q. Kidder and T.H. Vonder Haar, 1995, Academic Press, p466.
Images in Weather Forecasting: A Practical Guide to Interpreting Satellite and Radar Imagery, 1994, Cambridge University Press.
Meteorology Today: An Introduction to Weather, Climate, and the Environment, 1995, C.D. Ahrens, West Publishing Co.
The Atmosphere, F.K. Lutgens and E.J. Tarbuck, 1993, Prentice-Hall.
Introductory Oceanography, H.V. Thurman, 1988, MacMillan Publ. Co.
Introducing Physical Geography, A. Strahler and A. Strahler,1994, J. Wiley & Sons
Geosystems: An Introduction to Physical Geography, R. W. Christopherson, 1992, MacMillan Publ. Co.
In addition, EuroMET prepared a website course on Satellite Meteorology. To access this site, you must first get a user name and password through this address. When there, click on Satellite Meteorology. However, the writer, after a week of surfing the Net, did not found a really comprehensive Tutorial that explores the basics of meteorology. (If you know of one, please contact NMS.) Here is a general site operated by NOAA to give a quick overview: http://www.ncdc.noaa.gov/. Click on Search NCDC. You can enter any appropriate term or key word(s) in the Search Box. A good opening choice is “Meteorological Satellites”. Two other NOAA sites of interest are at NESDIS and NWS (National Weather Service). Try also the site maintained by USAToday, at http://www.usatoday.com/weather/wfront.htm. Three places in that site to click on are: The Basics; Topics Index; and Forecasting. Some instruction is also available on a site produced at the University of Illinois, at Current Weather User Guide. For a comprehensive, but general, review of U.S. meteorological satellites, check into this site, maintained by Florida State University: http://www.met.fsu.edu/explores/Guide. By exploring these sites, and others they point to, you should become familiar with what’s out there in the world of weather and climate. Another site, which has a somewhat tutorial approach, to check out is the Project Atmosphere Canada series of instructional pages.
Unfortunately, less material is available online that instructs in oceanography or hydrology. Because the Internet grows daily, you can try entering those key terms in your Internet Search Box. For now, let’s consider a few basic principles and concepts underpinning satellite meteorology.