Multitemporal Coverage
Contents
A very common type of “multisensing” is “multitemporal”, meaning that periodic repeat looks at the same ground area can be used to extract information otherwise more difficult to procure. The most obvious example is in crop studies, where imagery from different times in the growing cycle can be used to better identify the crops present and estimate their biomass state or anticipated yield. Special consideration is given to one excellent example of monitoring the changes over several years: the damaging effect of the Gulf War on Kuwait’s Burgan Oil Field and its subsequent recovery.
Multitemporal Coverage
Satellites are ideal for monitoring changes in accessible parts of the Earth over time. The repeat cycles of those that orbit at high angles to the equator are measured in days or a couple of weeks or so. This facilitates monitoring of crop growth and regional vegetation progression as well as drought and stress conditions. Clearcutting and environmental damage are effectively monitored. The effects of flooding can also be accessed, particularly now that there are a number of different satellites in operation, so that the likelihood of any area being covered on a given day has increased. Of course, daily weather changes are the mission of most of the meteorological satellites. In principle, the state of a surface that is not cloud-covered is observable, albeit at usually low resolutions, by the group of geostationary satellites now in place.
Long period changes (in years) are also suited to the steady presence of the stable of satellites in orbit. The mapping of growth of cities and population points and other land use categories is a straightforward use. The drying up of lakes (such as the Aral Sea) and the changes in areal extent of ice sheets and glaciers can be followed. Degradation and loss of wetlands generally are slow processes that still can be detected over time, perhaps early enough to reverse the trend.
We have seen several examples of change detection before, especially in Sections 3 and 4. Several more should suffice to document the utility of satellites for this purpose.
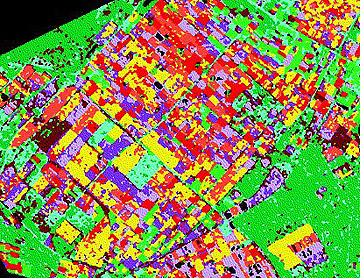
Staying with the agricultural theme, a Landsat TM classification of crops in coastal farmlands in the Netherlands was presented on page 3-2, with the comment that the single date coverage led to an accuracy of only 56%. However, when 20 dates of coverage during the growing season of 1993 were obtained with ERS-1 SAR (radar) coverage, and a supervised classification was carried out, this next image achieved an accuracy of 70% (see page 3-2 for a legend and listing of the 10 different classes).
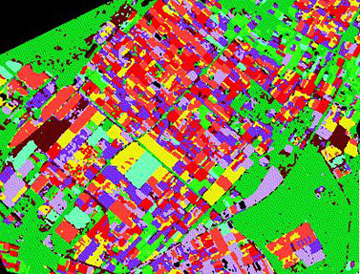
Then, when this above scene was merged with the Landsat TM classification, the image below resulted; it improved accuracy to an average of 79% for all classes.
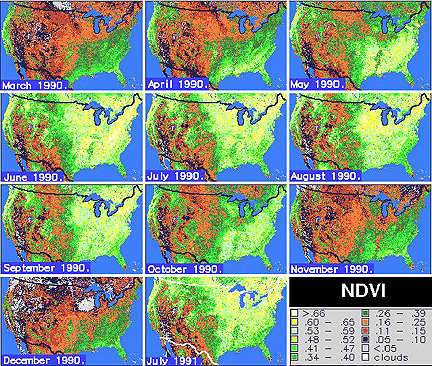
As stated before in this Section, AVHRR visible and IR data at 4 and 1 km resolution are readily processed into NDVI imagery for regions of varying sizes up to continental scale. Here are a series of images covering NDVI variations across the 48 U.S. states on a monthly basis from March through December 1990, along with a July 1991 image that can be compared with the July 1990 image. The “greening” of the country and regression during the Fall are easily traced.
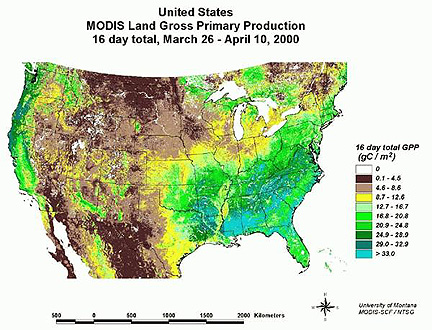
Continent-wide vegetation changes for shorter periods can be monitored by AVHRR and by other sensors, such as MODIS on Terra (page 16-9). Here the data being mapped are conversions of vegetation cover into gross biomass productivity.
Since the early Landsat days, there have been a number of U.S. and international programs to test the value of remote sensing, coupled with GIS, and other sources of relevant information to various vegetation studies, principally of crops, grasslands, and forests. Some of these are part of the ISLSCP (International Satellite Land Surface Climatology Project) program. Currently active is BOREAS (Boreal Ecosystem Atmospheric Study). Before that was the FIFE program which followed productivity of agricultural grasslands in the Konza Prairie Test Site near Manhattan, KS. Here is a composite Landsat TM image of the FIFE site:

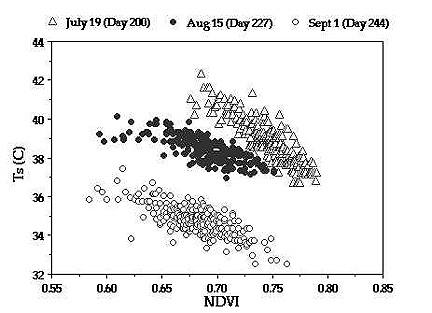
Many diverse studies were conducted on this site. One of interest, from which these next two graphs were extracted, was carried out by Scott Goetz. The first plot shows the variations in NDVI and LAI (Leaf Area Index) over most of the growing season, as followed by a large number of AVHRR observations and several by TM and the HRV on SPOT.

The second plot indicates the variations in temperature as determined by the AVHRR thermal channel as a function of NDVI (from AVHRR) for three dates in summer. As expected July produced the highest temperatures and the coolest were by September 1. As NDVI increased, the temperatures dropped owing to the cooling effect by evapotranspiration associated with the grasslands.
Geographic Information Systems (GIS) is now being widely used in crop management. A search on the Internet by the writer (NMS) found many references to GIS crop studies but almost none proved suitable (with good imagery and data sets) to be extracted into this Tutorial. We suggest you do your own search (using such key words as “crop identification” “crop management”, “GIS”, “remote sensing”). However, a good idea of GIS’s potential is reviewed in this Web site covering the Bighorn Basin, Wyoming.
Remote sensing and GIS have made huge impacts on how those in the agricultural industry are monitoring and managing croplands, and predicting biomass or yields. In fact, a new term has sprung up - Precision Agriculture - which carries with it the essentual components of remote sensing and GIS. Keywords associated with the tasks or goals involved are: farm management; crop needs; nutrients; pest/disease control; environmental contamination; crop species and variety selection; timing of field practices; conservation; soil organic matter; irrigation; minimizing erosion. Here is a good summary Internet site that treats Precision Farming.
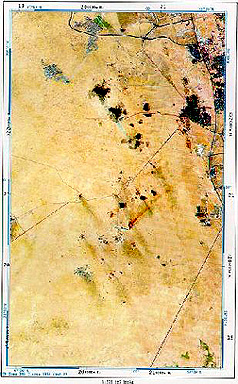
We close out this page that exemplifies the benefits of multitemporal remote sensing in a non-agricultural setting by following an intriguing case study of the damage and recovery of oil fields in Kuwait resulting from the 1991 Gulf War. We begin with part of a Landsat TM scene of Kuwait before the war; roads and gas-burning plumes are evident.
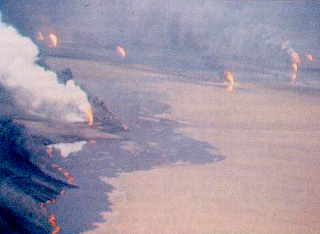
During the Gulf War, before they pulled out, Iraqi troops set many oil wells on fire. The most extensive ignitions occurred at the large Burgan oil field in southern Kuwait.
The next image is a TM subscene taken soon after war’s end, with the black area being the soot and burned-out facilities at the Burgan field.

This pair of Landsat TM scenes show close-ups of the burned area on November 14, 1991 and March 3, 1995. In the 1995 image, you can see that some of the damaged area is being restored by natural and planted grass land cover.


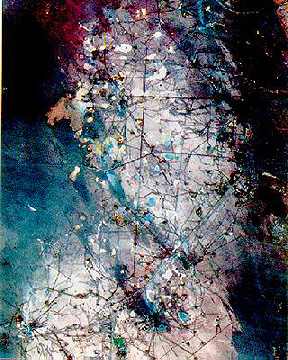
This next image is a further enlargement of the Burgan field area in which the color patterns denote discernible changes between 1987 and 1993, brought out by a change detection merge of images from those two dates.
We will now wind up these last three pages with a case study of one area and subject which illustrates how the various “multi’s” work together to symbiotically enhance knowledge and understanding of a scene and a theme as examined primarily from space.
Primary Author: Nicholas M. Short, Sr. email: nmshort@nationi.net