DETERMINING TOPOGRAPHY FROM SPACE
Contents
A TIP TO THE USER: MANY OF THE IMAGES IN THIS SECTION ARE STEREO PAIRS. SOME PEOPLE CAN SEE THESE IN 3-D DIRECTLY FROM THE SCREEN, WITH UNAIDED EYES, BUT MOST NEED A STEREOSCOPE TO VIEW A PAIR. WE SUGGEST THAT YOU PRINT OUT A PAIR AND EXAMINE THEM WITH A STEREOSCOPE (OR BY THE VIEWING TECHNIQUE DESCRIBED LATER IN THE TEXT). IF IT STILL DOES NOT FUSE INTO 3-D, THEN CUT THE PAIR APART AND MOVE ONE RELATIVE TO THE OTHER WHEN PLACED SIDE BY SIDE UNTIL THE 3-D EFFECT IS CLEAR.
Note: If you do not have access to a stereoscope, and are unable to see in 3-D without one, then you will be unable to try to answer some of the questions. Just skip them, or at least read their answers.
One major topic that is customarily included in any review of Photogrammetry (Page 10-3) is that of experiencing the three-dimensional nature of objects that we see directly with our eyes. This stereo capability is vital to our sensual power to negotiate the world about us - for example, we must be aware of the depths or distances of objects before us as we move about. It is possible to duplicate this sense of stereo using aerial or space imagery. Normally, this requires two images offset along the direction of the flight line (or through sidelap) that each share part of the same scene but visualized from different angles. This mimics the way in which our eyes see from slightly different angles, owing to the distance apart between the eye pair. This Section examines what stereo is and how it is produced through sets of imagery. Its application to producing topography maps (also doable using altimetry) is a main topic. The first page reviews types of maps and map projections and introduces concepts of contours as seen on topographic maps.
DETERMINING TOPOGRAPHY FROM SPACE
Ways to Characterize the Earth’s Surface on Maps
Most “look down” remote sensing focuses on the Earth’s surface. The big exception is, of course, remote sensing of the atmosphere. Some surface features are readily apparent, such as tree tops, building tops, etc. On land, the real natural surface is usually soil or rock. On the oceans it is, obviously, the sea surface, although we could argue that the ocean floor is a continuation of the solid land surface. One definitive property of these surfaces is the nature of their composition, typically either rock/soil, water, vegetation, or manmade coverings. These materials are the constituents of the targets, further defined by form and use, which we try to identify using remote sensing devices, by sampling the electromagnetic radiation emanating from them.
` <>`__11-1: Such features appear two-dimensional in an aerial or space photo, although one often can get a sense of three-dimensionality from either shadowing effects or the psychology of recognizing a feature and knowing (commonly, intuitively) that it has a definite shape that we recognize as 3-D. Mention several advantages of being able to see a surface and objects thereon in three-dimensions. `ANSWER <Sect11_zanswers.html#11-1>`__ ****
Earth’s surface is not flat over large distances, and commonly, not even locally. The surface continuum of the Earth’s sphere curves variably or undulates with respect to a reference shape. In fact, measurements have shown that Earth’s gross shape is not a true spheroid, i.e., all points on the surface are not equidistant from the geometric center. Instead it is an oblate ellipsoid, in which the radius to the polar regions are slightly less than that to its equatorial belt, because its internal materials bulge outward in response to centrifugal forces developed by Earth’s rotation. Large clumps of dense rock and soil located in the crust and outer mantle further modify this ellipsoidal surface.
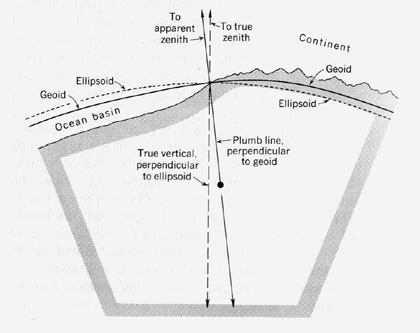
This modified ellipsoid gives rise to the geoid, a figure in which the surface broadly curves under or above the ellipsoid as gravity pulls on these masses. We define the geoid as the shape assumed by the Earth’s globe that would hypothetically occur if gravity were constant at all points on its surface. In the oceans this shape almost coincides with mean sea level (see below). Geodesy, the science of the Earth’s shape, tells us where the geoidal surfaces depart from the ellipsoid, which, worldwide, tend to range between about -100 to +70 m. Geodesy techniques initially included gravity measurements in the field, and during the last 40 years have depended on refinements resulting from perturbations in satellite orbits caused by gravitational variations. Even this shape still does not precisely characterize the true state of the surface because ocean levels change slightly from place to place, because of winds swelling water bodies, thermal expansion, tides, etc. Land shapes change further by tectonic and isostatic deformation and by erosion that raises, lowers, and inclines surfaces relative to the geoid . On land, in particular, these surface changes can be out of “sync” with the locations they would assume if ideally adjusted to gravity. The relation between the surfaces associated with the ellipsoid, the geoid, and the land/ocean bottom surface is evident in the next diagram. Here, a cross section of a part of the outer global interior shows the smooth curves for the two “oids” and the irregular profiles that generalize ocean floor and continental surface outlines.
` <>`__11-2: The geoid is itself not the actual surface but a gravitational approximation. If the maximum relief on the Earth’s true surface is set as the difference in elevation from the high point (Mt Everest in the Himalayas, at just over 29000 ft) and the low point (about 36200 feet below sea level in the Marianas trench (Pacific Ocean), express this difference in elevation (relief), and thus an up-down (radial) departure from a true sphere as a percentage of the Earth’s average radius (3980 miles). `ANSWER <Sect11_zanswers.html#11-2>`__
Cartography is the specialty that maps the Earth’s surface in selected areas onto paper sheets (normally). A planimetric map shows locations and features on the surface that are at different heights above or below a reference (datum) plane. In their relative positions, they appear as though projected onto an X-Y (horizontal) coordinate system. Each point on the map corresponds to a point on the Earth’s surface. These surface points, however, are distributed on the curved surface of the Earth. Thus, to locate the points, we must reference them to a geographic coordinate or grid system, the most common being that of latitudes and longitudes. Latitude lines run parallel to the equator, each one being a successively smaller circle as we move toward a pole. Longitude lines are meridians, great circles of equal radius that pass through the poles and are perpendicular to all latitude lines.
We encounter problems representing these points along a curved (topologically distorted) surface, when we project them onto a map plane. Cartographers address this problem by using a transformation between spherical and planar geometry. They create a specific projection that systematically transfers the surface points (latitude and longitude) to a reference surface, such as a cylinder, enclosing the globe, a cone, or a plane tangent to some part of it, which they can further “unwrap” into a two-dimensional plane (the map). Any transformation of an area on the sphere to a plane results either in distortion of the areal scale or of the shape. Different projections strive to minimize one or the other distortion. Conformal projections seek to preserve true shape: the best known of these is the Mercator (cylindrical), in which they space meridians equally and parallels become closer near the equator. This geometry tends to enlarge the areas of land masses at high (nearer to the poles) latitudes. Equal-area projections, such as the Goode homolosine, typically have non-straight longitudes and may have unusual outlines. The polar projection, best for representing polar regions, centers on the north or south pole, around which is a series of concentric circles (latitudes) and straight radial lines (longitudes) outward to the outermost circle (the outline of the map). Depending on the projection type, the map scale can be constant or may vary.
` <>`__11-3: What does this notation mean: lat 34°12’31” S, long. 77°03’41’ E? Is the length of 1° of latitude and 1° of longitude the same at the equator and near the poles? `ANSWER <Sect11_zanswers.html#11-3>`__
Topographic Maps and the Concept of Contours
Once tied into the geoid, surveyors take measurements to establish elevations inland (or along the ocean floor). On land, for more than a century they have used theodolites (transits), which are instruments for measuring angles consisting of a telescope that freely rotates 360° horizontally and pivots from 0° to 90° vertically. Today they may use laser beams for ranging (determining direction, distance, and elevation to points being surveyed) and the Global Positioning System for location. By using chains and stadia rods, they determine horizontal distances and directions (bearings or azimuths) from their instrument to a survey point or station with high accuracy. They measure lines along levels and calculate trigonometrically the vertical differences in elevation between points. In this way, they can run survey lines starting either from coastal sea level locations or from points inland of known three-dimensional position to establish benchmarks (points of accurately determined geographic position and elevation). They develop nets of baselines and extensions anchored by these benchmarks using triangulation methods and other surveying procedures, and gradually the nets extend throughout a region and ultimately may cover a continent. These nets serve as control points from which we get topographic maps of various scales (and therefore details). These maps display the usual planimetric features, including latitude-longitude coordinates, specific scales, and projection type.
One of the spin-off uses of these surveys is to set up specific ground control points that are needed to properly make measurements in aerial photos, especially, as we shall see, when these are to be used in making topographic maps. These may be horizontal or vertical control points, or both. The points must be identifiable both on the ground and in the photos. As an example, the interesection of two roads will fulfill this function, being easily located on the surface and normally being readily discernible in aerial photos having wide ranges of scales (but not necessarily visible in space imagery of intermediate resolution or less).
Variations in the third dimension, from which one is able to envision changing surface curvature and to calculate relative heights of different points on the surface, can be depicted on maps by using contour lines. A contour line connects all points of equal elevation within the mapped area. To picture such a line, imagine that you are standing at the base of a hill that rises from a flat plane and peaks in a single crest point 100 m (328 ft) higher. If you walk around the hill base, keeping constantly at the same elevation, and trace your path somehow (such as painting the line of your trail), you would have a line, similar to a contour line on a map. Now if you move up the hill a fixed distance, say 20 m (66 ft) higher than the base, and again walk around the entire hill, marking your way, you would have another contour line, which is a slightly different shape. If you continue moving upslope at 20 m (vertical or elevation) intervals and each time walk horizontally around the hill, and mark your path, as you approach the crest, your walk will be a minimal length but still will return to the original starting point (is closed). When you view these traces from high above, you will see the successive traces as a set of concentric closed lines, each interior one of lesser total length than the lower one outside. If labeled, each line has a value 20 m higher than the next outside one. If the base were assigned a value of zero, then the upward sequence would go through 20, 40, 60, 80, …., up to the value of 100 m. The crest may be a few meters higher than 100, say 105 m, and would be plotted as a point within the innermost contour. If the base chosen lies above sea level, say at an elevation of 120 m, then the sequence would be 120…140…160…180…200…220 m (with the crest point labeled 225 m).
` <>`__11-4: Imagine drawing contours on the top half of your head. Starting at the top of your ears, you can trace a circle around your head (perhaps using a scissors to cut away hair along a very thin trace path). Then trace the next contour a quarter inch higher, and so forth, until you reach the top. From above what would this circle-line haircut look like? `ANSWER <Sect11_zanswers.html#11-4>`__