Firstly, we used MRT developed by USGS EROS data center to carry out geometric correction and Mosaic processing for MOD11A2 and MOD13A2, and then cut the data by using the vector boundary of the Mongolian plateau, and synthesized the surface temperature data, NDVI data and EVI data of the Mongolian plateau every 8 days. The surface temperature of the growing season (April to October) was obtained by means of average synthesis method, and then the average surface temperature of the land surface for the seven months of the growing season was obtained, and the average surface temperature for each month from 2000 to 2012 and each growing season was obtained respectively. The maximum synthesis method was used to obtain the monthly NDVI and EVI of the growing season (April to October). The maximum synthesis method was still used to obtain the maximum NDVI and EVI of the growing season each year, and the maximum NDVI, EVI, and the maximum NDVI and EVI of the growing season from 2000 to 2012, respectively.
We first used the Mongolian plateau boundary vector map to uniformly cut the AVHRR-PathFinder data. The preparation process of NDVI is as follows: NOAA-AVHRR data source with radiation correction and geometric rough correction is adopted, and then geometric fine correction, bad line removal and cloud removal are further carried out for each rail image, and then NDVI calculation and synthesis are conducted.
NDVI was obtained by atmospheric calibrated visible light (0.58-0.68um) and near-infrared band (0.725-1.1um) reflectivity. And it was synthesized by the maximum synthesis (MVC) method, effectively removing the influence of cloud. Ruled out in the process of synthesis of observing zenith Angle was greater than the 42° as metadata, the synthetic process can effectively reduce the effect due to 2 to reflex point of view, besides, the observation Angle for the atmospheric correction of the impact of NDVI was relatively small. The specific synthesis process can be found on the data description website.
The synthesis of surface temperature takes advantage of the 4 and 5 channel brightness temperatures that have been radiation-corrected at the corresponding time. The ground surface specific radiation rate of 4 or 5 channels obtained by Josef et al. and NDVI were used to calculate the land surface specific radiation rate, and the split-window algorithm proposed by Becker & Li was used to calculate the land surface temperature on the sub-basis. To some extent, the split-window algorithm reduced the influence of solar height Angle and atmospheric water vapor on thermal infrared information.
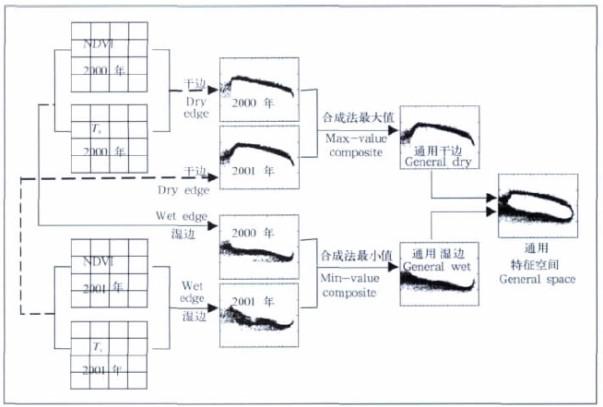
Yu Min thought that if the earth's surface in the study area generally covered type changed little, then you can use for many years in the same period satellite observation data, the synthesis of the same period each year of synthesis for Ts - NDVI feature space boundary, in order to improve the traditional only based on the current feature space of the single satellite observation data, improve the stability of the dry and wet edges to make the feature space based on satellite observations boundary close to its maximum extent theory boundary, and this is based on a long period of time, a wide range of satellite observation data to improve the characteristics of space called " general feature space".
Specific synthetic steps: (1) For one time, and separate extraction from year to year based on the single time Ts - NDVI characteristics of satellite observation data space: from the bare soil to the closed canopy, with smaller between vegetation index, maximum synthesis method was used to extract each corresponding maximum surface temperature and vegetation index form into a single during the dry side of the feature space surface temperature; The minimum surface temperature corresponding to each vegetation index is extracted by the minimum value synthesis method to form the wet-edge surface temperature of the single time period of the year. (2) Synthesize the all-year T-NDVI feature space: with the same vegetation index interval, extract the maximum multi-year maximum surface temperature corresponding to each vegetation index in the dry-edge surface temperature of the extracted single-period feature space in each year, and take it as the dry-edge surface temperature of the common feature space; The minimum surface temperature corresponding to each vegetation index is extracted by the minimum value synthesis method, which is used as the wet-edge surface temperature of the universal feature space.(3) The dry and wet boundary of the common feature space can be obtained by linear fitting with the above vegetation index interval and the surface temperature of the common feature space after synthesis:

Where, was the vegetation index of a pixel,
 was the surface
temperature of the dry and wet edges corresponding to the synthesized
general feature space(
was the surface
temperature of the dry and wet edges corresponding to the synthesized
general feature space(  ), and a1、b1
、a2、b2
were respectively the intercept and slope of the wet and dry edges of the
general feature space, obtained through linear fitting. The process of
synthesizing the common feature space was shown in figure 1.The general
feature space method was based on the long-term, large-scale satellite
observation data to resynthesize the feature space boundary of a single
time period for many years, but did not resynthesize the data of each pixel
in the satellite observation image,avoiding the influence of surface type
change of each pixel in the feature space as much as possible.
), and a1、b1
、a2、b2
were respectively the intercept and slope of the wet and dry edges of the
general feature space, obtained through linear fitting. The process of
synthesizing the common feature space was shown in figure 1.The general
feature space method was based on the long-term, large-scale satellite
observation data to resynthesize the feature space boundary of a single
time period for many years, but did not resynthesize the data of each pixel
in the satellite observation image,avoiding the influence of surface type
change of each pixel in the feature space as much as possible.
Based on the general characteristic space dry and wet edge equations (1) and (2) obtained by synthesis, the temperature vegetation drought index is calculated:

Where a1、b1、a2、b2 were the coefficients of the fitting equations of dry side and wet side respectively.
Land surface temperature (LST) is an important environmental variable, which determines the exchange of energy and materials between the surface and atmosphere. It is an important object in interface research, a good indicator of the energy balance of the earth surface and the greenhouse effect, and a key factor in regional and global surface physical processes. The split-window algorithm is the most widely used algorithm at present. At first, it is mainly used to determine the temperature of sea water. Later, it is extended to invert the surface temperature. The algorithm is introduced as follows:
The radiation received by the sensor at band i can be expressed by the following radiation transfer equation:

Where: B is the Planck function of the band, Ti is the bright temperature
of the band,  is the atmospheric transmittance
when the band i is at the
zenith Angle,
is the atmospheric transmittance
when the band i is at the
zenith Angle,  is the land-surface specifi
c radiance of the band, T
is the real surface temperature,
is the land-surface specifi
c radiance of the band, T
is the real surface temperature,  is the
bidirectional reflectance of the band
,
is the
bidirectional reflectance of the band
,  is the downward atmospheric radiation of the
hemisphere of the band, and
is the downward atmospheric radiation of the
hemisphere of the band, and
 is the upward atmospheric radiation of
the band's emission direction.
is the upward atmospheric radiation of
the band's emission direction.
In this study, Becker and Li's algorithm was used to calculate the land surface temperature of the Mongolian plateau from 1981 to 1999.The specific calculation steps are as follows:
(1) NDVI (normalized differential vegetation index)
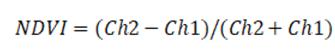
Where, Ch1 was the visible channel, Ch2 was the near-infrared channel, and the value of NDVI is between -1 and +1.
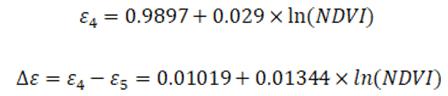
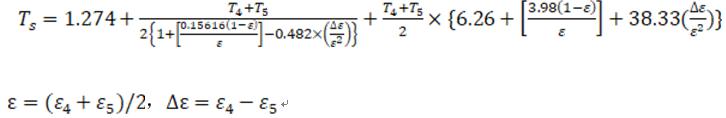
(2) Calculated surface radiation rate (ε). Josef et al., on the basis of the existing work, calculate the AVHRR ε4 and Δε, equations as follows:
(3) Calculate the surface temperature (Ts)
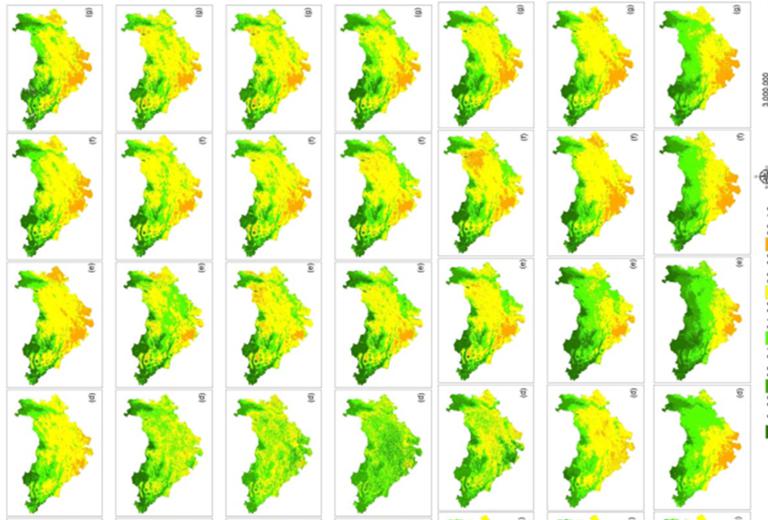
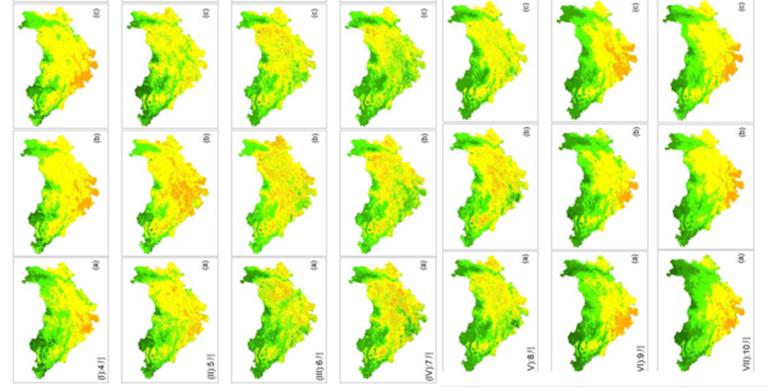
We used the mean value method to obtain the distribution of the mean TVDI of the growing season from April to October in the seven study periods, as shown in figure 2. The results showed that the TVDI spatial and temporal distribution results of the general characteristic space calculation of Ts-NDVI established by AVHRR NDVI-PathFinder and MODIS data were basically consistent. And TVDI can be used as the index of drought classification to reflect the overall drought characteristics of the Mongolian plateau. The drought distribution of the Mongolian plateau presented a zonal distribution pattern that changed with the change of surface vegetation type, surface vegetation cover, and latitude. Drought was widespread and serious in areas with low vegetation coverage and poor vegetation growth. From the perspective of latitude, the lower the latitude, the more obvious and serious the drought phenomenon; The higher the latitude, the better the drought, which was also determined by the zonal characteristics of the topography, landform and vegetation distribution.
From the perspective of land use type, there was basically no drought in the forest region. In the northern and central grassland, excepted the local area was humid, the drought status in most areas was normal. In the southern part of the grassland, drought occured in a wide range, and the drought status was in the level. The drought was most severe in the bare land and desert areas of the south.
From the perspective of administrative division, the extremely humid and humid areas were mainly distributed in the Daxinganling forest region of Inner Mongolia, the forest region in the north and east of Mongolia, and the forest region in the east and west of tuva republic. The areas with normal drought status were mainly distributed in the grassland areas with good growth and high coverage in the north and west of Mongolia, around the Daxingan mountain in Inner Mongolia, and in the eastern and central parts of Inner Mongolia autonomous region. Drought grade for drought and extremely drought area mainly distributed in central and southern Mongolia looks like the coverage was low, poor grassland area, desert and gobi area, desert and gobi area in the south of Mongolia. In the eastern and central parts of Inner Mongolia autonomous region, large areas of drought occurred. In addition, the occurrence of drought disasters was also common in the desert and gobi regions in the western part of Inner Mongolia autonomous region.
The results showed that, in terms of multi-year average, the drought level of the Mongolian plateau was about 130.94×10⁴km2, which was drought, accounting for 44.03% of the total area. The extremely drought area was about 22.24×10⁴km2, accounting for 7.48% of the total area of the whole area. The drought area was about 83.18×10⁴km2, accounting for 27.97% of the total area of the whole area. The humid area is 43.57×10⁴km2, accounting for 14.65% of the total area of the whole area. The extremely humid area was the smallest, only 17.44×10⁴km2, accounting for 5.86% of the total area of the district. The drought area was the first of the five drought level areas, the normal drought area was the second, the humid area was the third, and the extremely drought and extremely humid areas were small.
Areas classified as extremely humid and humid were classified as humid areas, while areas classified as drought and extremely drought were classified as drought areas. In general, the area of the drought region in the study period was 112.88×10⁴km2-219.19×10⁴km2, accounting for about 37.96%-73.71% of the total area of the study area. In terms of the multi-year average, the area of the drought region was 153.17× 10⁴km2, accounting for 51.51% of the total area.
It can be seen that drought is common in the Mongolian plateau and severe in a few years.
Comment list ( 0 )

