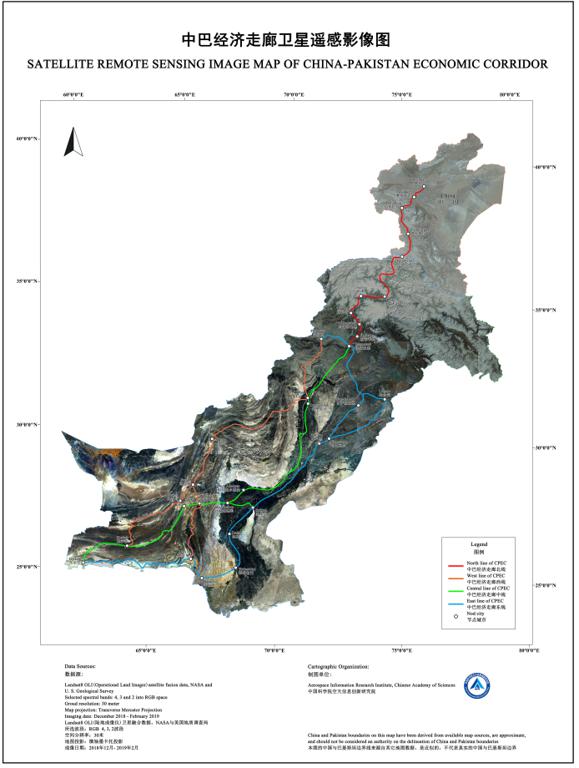
The data sources are NPP/VIIRS night light remote sensing monthly data of NOAA/NGDC, Landsat 8 satellite data, meteorological station monitoring data in China Pakistan Economic Corridor area, and project source data collected and integrated by DRRKS team. It shows the distribution of basic geographic data including administrative boundary, traffic road, DEM, building and water body of China Pakistan Economic Corridor, as well as relevant natural resource data, ecological environment data, remote sensing product data, etc. After atmospheric correction, geometric correction, blending and mosaic, the basic remote sensing image data set of China Pakistan Economic Corridor, the high temperature heat wave data set of China Pakistan Economic Corridor, the 500-meter night light data of Pakistan and the visualization platform are obtained. Data processing method mainly includes envi, ArcGIS and python.
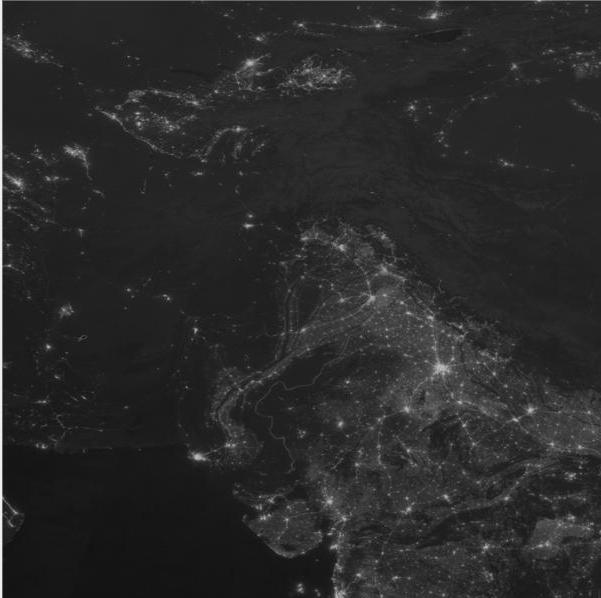
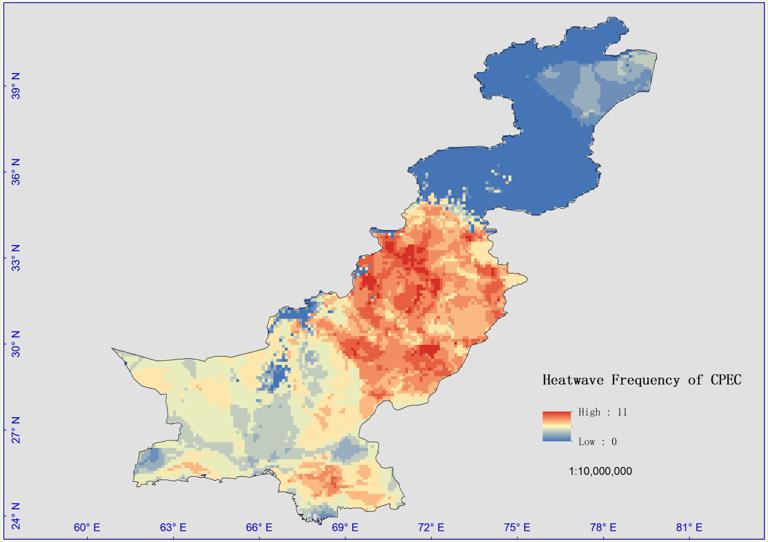
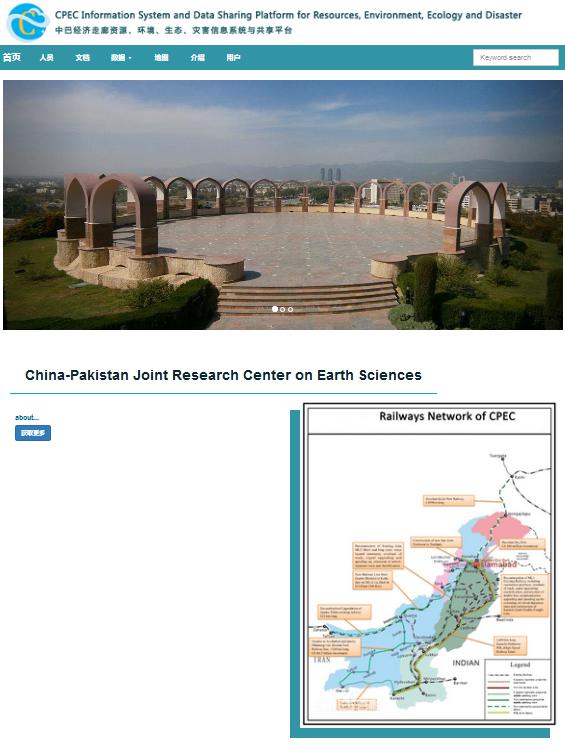
Based on the NPP/VIIRS night light remote sensing data synthesis, the annual 500-meter luminous data covering the whole Pakistan from 2012 to 2020 are obtained. Due to the influence of atmosphere, moonlight, polar day, etc., NPP/VIIRS data have great fluctuation and inconsistency in temporal. Therefore, this research develops a noctilucent data consistency processing model using smoothing constraints, which can remove noise and error of NPP/VIIRS night light remote sensing data into the greatest extent on the basis of ensuring the authenticity and accuracy of the data to improve the consistency and continuity between annual and monthly data of long time series, and provide technical support for obtaining standard annual and monthly night light remote sensing data sets. Using remote sensing image processing software (ENVI + IDL, Arcgis10.4) and Python, the multi-source, multi time series, multispectral Landsat series remote sensing image data are processed and analyzed in batch to obtain the basic remote sensing image of China Pakistan corridor and construct the basic image database. At present, the percentage threshold criterion is used to define the high temperature heat wave by combining the relative temperature threshold (RTT) and the absolute temperature threshold (ATT). Through downloading and processing the monitoring data of meteorological stations covering the China Pakistan Economic Corridor, and calculating the high-temperature heat wave data of this area, the high-temperature heat wave data set covering the China Pakistan economic corridor area is obtained from 2000 to 2018.The vegetation includes the frequency, the total duration, the longest duration and the maximum temperature of high-temperature heat wave. Based on pycsw tool, a system for data exchange and interoperability is established to realize the functions of metadata registration and storage, audit and release, directory retrieval, browsing and display, maintenance and update of various data, and realize the online navigation and association of metadata, and meet the one-stop access and acquisition from metadata to data entities. Based on information technology, the panoramic management and visualization display of data of resources, environment, ecology and disaster elements in multi-temporal and spatial scales are realized. Based on MapServer technology, data resources are managed and released by GISLite tool developed by DRRKS team. In the front, we use JavaScript class library Leaflet to realize visual interaction.
Comment list ( 0 )

