Measurement scale of data
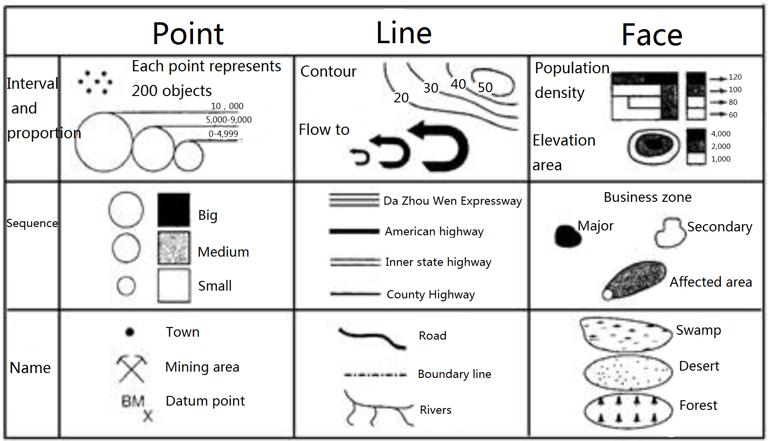
The measurement of specific phenomena is to assign or score them according to certain criteria. In order to describe the geographical world, everything must be identified, classified and named. These are all part of the measurement. They use different reference standards or scales. The measurement scale can be roughly divided into four levels, from rough to detailed: naming or type, order, interval and proportion.
Nominal quantities
Qualitative rather than quantitative, can not do any arithmetic operations, such as the name of a city. Nominal measurement scales are also called type measurement scales, which only identify specific phenomena and assign certain values or symbols without quantitative description. For example, different numerical values can be used to represent different land use types, vegetation types or rock types, but there are numerous relationships among these values. The logical operation of named data can only be in the form of “equal” or “not equal”, and its approximate mean can only be in the form of mode.
Ordinal quantities
In linear coordinates, instead of the size of the value, the number is arranged in order. For example, the level of accident risk is marked as 1, 2, 3,… From large to small, the lower the rank number, the greater the risk, but the extent of the risk has not been quantitatively expressed. Ordinal values can be compared with each other, but can not be added, subtracted, multiplied, divided and other arithmetic operations.
Sequential measurement scales are based on sorting phenomena, for example, peaks can be classified into extremely high mountains, high mountains, middle mountains, low mountains and hills according to their height, and slopes can be classified into steep, moderate and gentle slopes. The size of the interval between different orders can be different. In addition to “equal” and “not equal”, logical operations on sequential data can also compare their sizes, that is, “greater” or “less”.
Interval quantity
Instead of referring to a fixed point, the number of relative positions is represented by intervals. The values measured at intervals can be compared with each other, and the difference between them is meaningful.
The interval measurement scale is similar to the scale measurement scale, but the measurement of the interval scale has no true zero value. For example, temperature is an interval-scaled data rather than proportional data because its “0” measurement varies with the different temperature measurement units used. It cannot be said that the temperature of 150F is twice the temperature of 75F, because this ratio changes when using Celsius units. Conversely, precipitation is proportional data because it has a true zero value . The proportional data and interval data can be used for addition, subtraction, multiplication, division, etc., and can be arithmetic averaged.
Ratio quantity
The measurement value of proportional measurement scale refers to those data with true zero value and equal interval between measurement units, the scale of proportional measurement has nothing to do with the unit of measurement used.
The ratio calculation with a fixed point supports a variety of arithmetic operations, such as addition, subtraction, multiplication, division, etc. There are many examples of this type of attribute domain, such as annual rainfall, altitude, population density, incidence, etc.
Scale data or interval data can be easily converted into sequential or named data. Named data can hardly be converted into sequential, interval, or proportional data. Thus, although named data or sequential data are easy to use and understand, they are sometimes inaccurate and cannot be used for higher-level arithmetic operations. The scale data or interval data are more accurate and easy to be processed by computer, but in more complex GIS applications, the data of the above measurement scales are often needed.